Renko Charts Indicator
Platform: MT4 Type: Pattern Last update: September 28, 2024The Renko Chart was originally developed by Steve Nison and first introduced to the world in his book “Beyond Candlesticks”.
What actually is a Renko Chart? Simply speaking, it is a type of price charting. I am sure you know about the Japanese Candlestick Charts, Bar Charts, Line Charts. The Renko Chart is also very popular, but unfortunately, it isn’t included in the MT4 platform as standard. The name of the Renko Chart comes form the Japanese word “renga”, which literally means brick.
It’s not hard to guess why it was named like that, as the Reno Charts present price movements using rectangles that look just like bricks.
How Are Renko Bricks Formed And Calculated?
In essence, Candlestick Charts and Renko Charts are very different. The main difference between these two types of charts is the information they show and how they are formed.
The traditional Candlestick Chart uses the open, high, low, and close of each session. In other words, it measures price movements in relation to time periods. The Y-axis of the chart represents price levels, while the X-axis of a chart indicates time intervals.
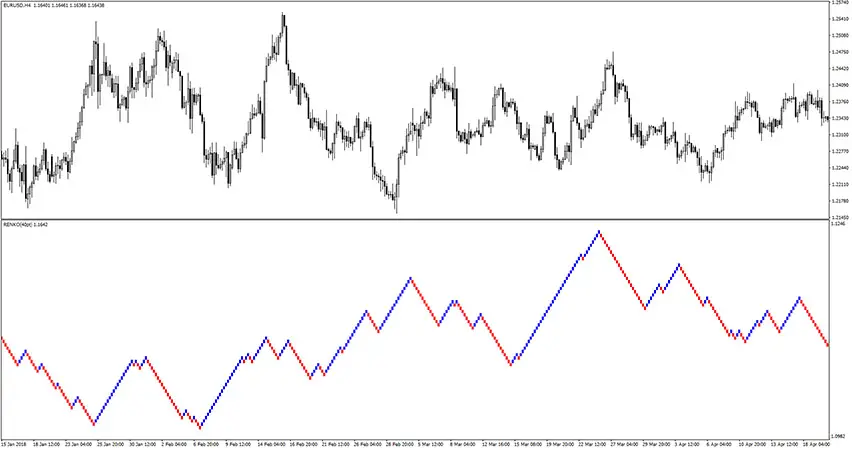
The Renko Chart is significantly different from this type of price presentation, as it totally ignores the time factor and focuses solely on price movements. That formula creates a chart that effectively indicates momentum and trend, based strictly on price movements. Each brick of the Renko Chart represents a unit of price movement.
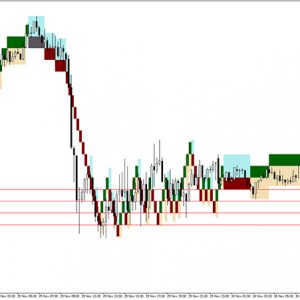
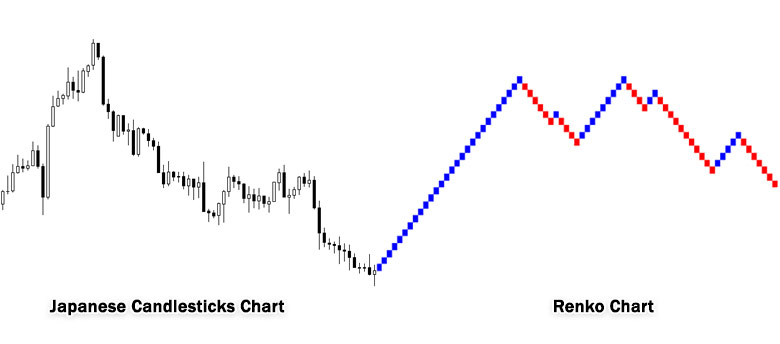
These bricks are formed depending on your setting, meaning they will only form once the price has moved a certain distance in pips. For instance, if you have set that price must move 40 pips before creating a brick, then the Renko Chart will not form a new brick until the price has moved 40 pips. Check the comparison picture below to get know how different Japanese Candlesticks and Renko Charts are.
How does it work? How to apply Renko in trading?
Trading Rules Explanation
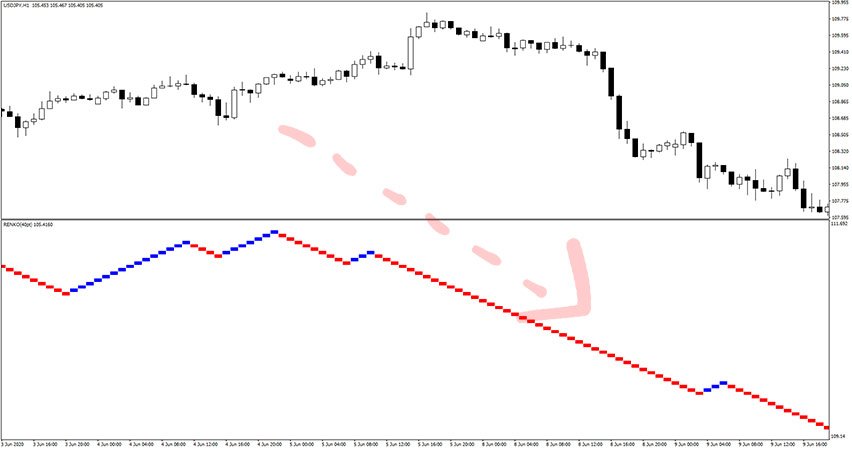
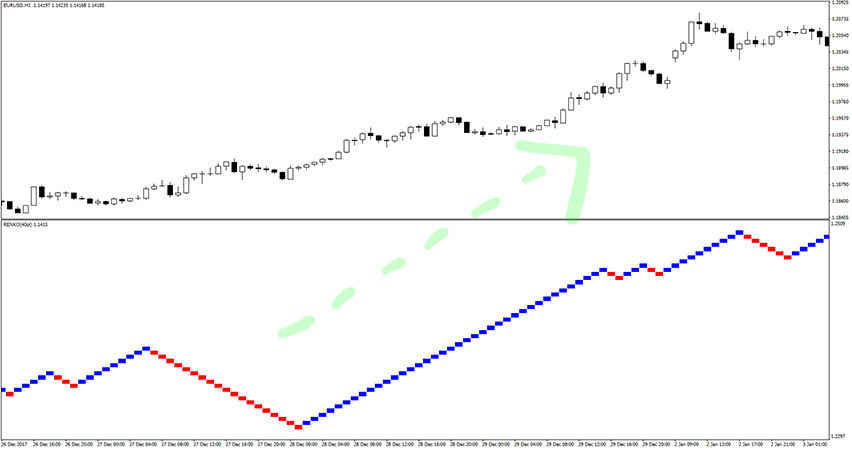
There are many ways to trade with the Renko Charts Indicator. On the one hand, it shows a smooth and clear picture of the trend. On the other hand, you must be aware that Reno Chart plots price movements regardless of the period covered, therefore it may not correspond to Japanese Candlesticks at the same time.
You will need to manually determine the price corresponding to Renko bricks. It simply has advantages and disadvantages. Let us show you the most basic and simple strategy for trading using Renko Chart.
Buy Signal
Follow these steps for a long trade:
- Renko Chart should form at least three consecutive blue bricks
- Determine the price corresponding to the high of the third blue brick
- Open buy trade at that price level
- Set stop loss a few pips below the last swing low of the price (not brick)
- Take profit or exit trade whenever you get at least 1:1+ Risk:Reward ratio, or use your own method of trade exit
Sell Signal
Follow these steps for a short trade:
- Renko Chart should form at least three consecutive red bricks
- Determine the price corresponding to the low of the third red brick
- Open sell trade at that price level
- Set stop loss a few pips above the last swing high of the price (not brick)
- Take profit or exit trade whenever you get at least 1:1+ Risk:Reward ratio, or use your own method of trade exit