VWAP Indicator MT5
Platform: MT5 Type: Market Levels Last update: July 19, 2026The WAP Indicator for MT5 calculates the average price of a currency pair based on trading volume.
It helps traders analyze market activity and is displayed as three lines on the chart.
The VWAP acronym stands for Volume Weighted Average Price.
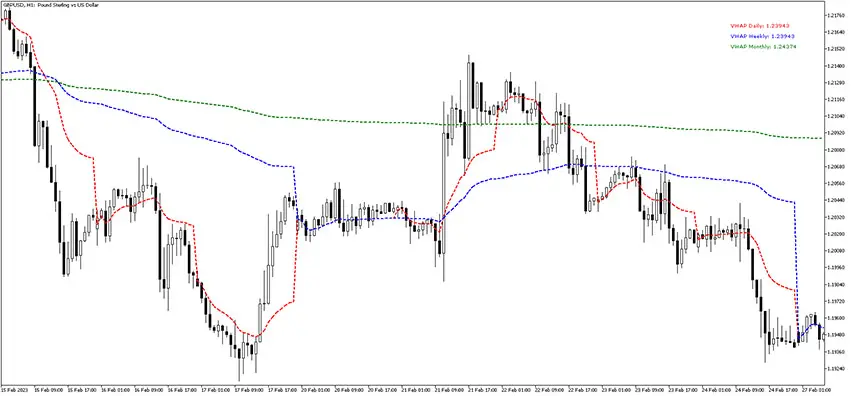
Example chart:
How to use the VWAP Indicator for MT5?
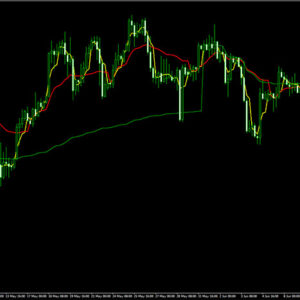
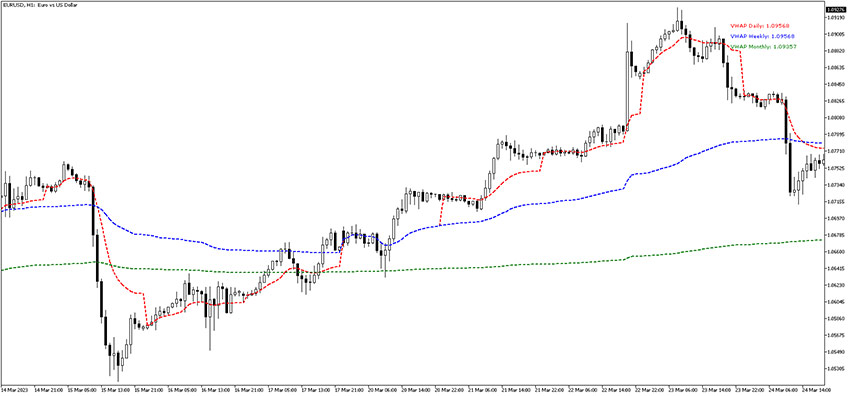
The VWAP indicator plots three lines: daily (red), weekly (blue) and monthly (green)
It calculates average price based on weighted volume, which helps identify support and resistance levels for entries and exits. Trade signals form when the weekly and monthly lines cross.
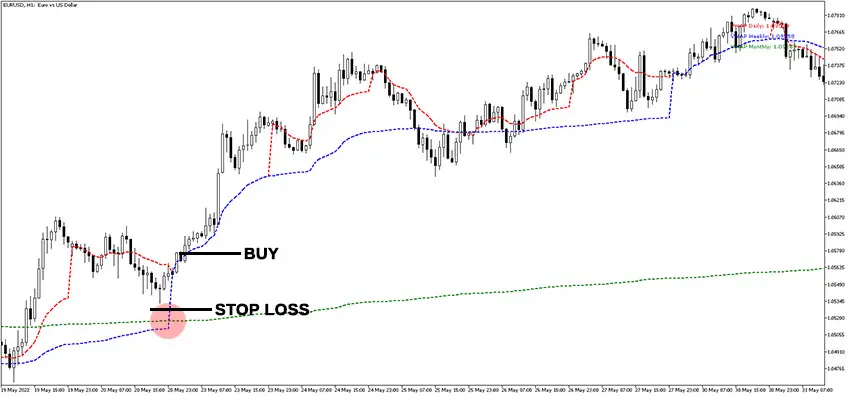
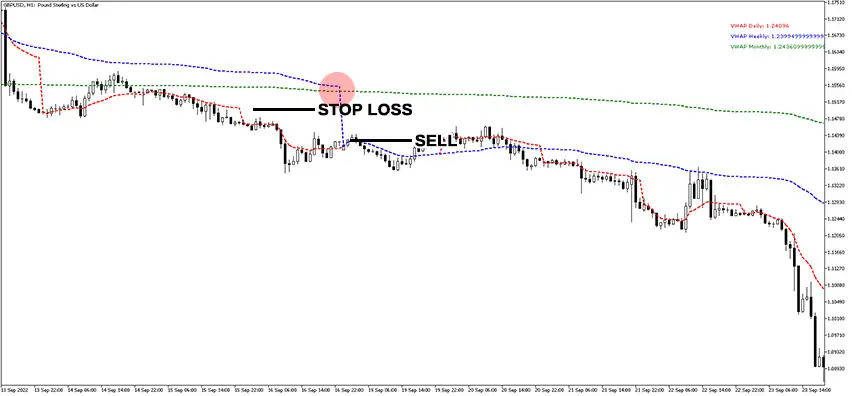
A bullish trend triggers when the blue line crosses above the green line. A bearish trend takes place when it crosses below.
The daily red line is neutral and follows the trend direction – rising during uptrends, falling during downtrends. It works alongside either signal rather than generating its own.
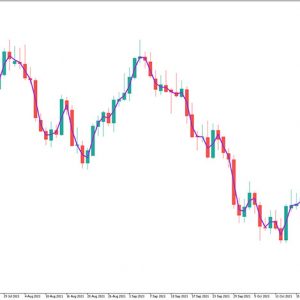
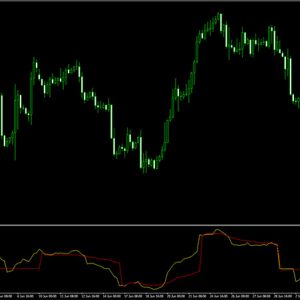
You can see examples on the EUR/USD and GBP/USD charts below.
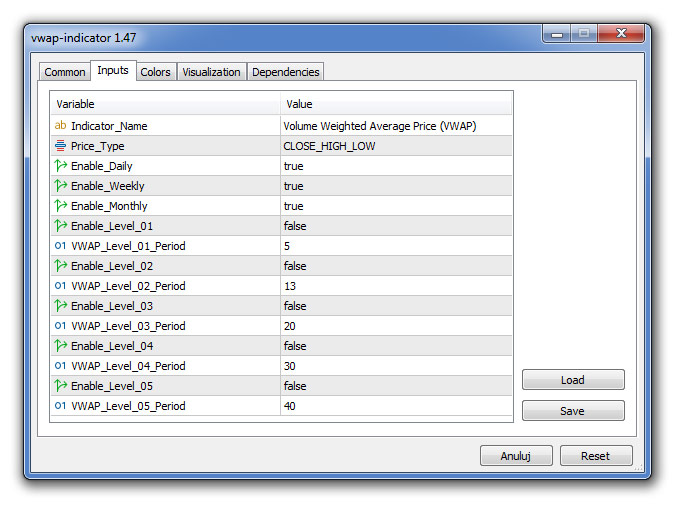
Settings
These are available settings to customize in the input tab window:
Conclusion
The VWAP Indicator for MetaTrader 5 is valuable, because its crossover signals are backed by actual trading volume, not just price movement.
When the weekly and monthly lines cross, you’re seeing where real buying or selling pressure is shifting, not just where price happens to be drifting.