Traders Dynamic Index (TDI) Indicator
Platform: MT4 Type: Channel Last update: October 6, 2024The Traders Dynamic Index indicator first appeared in the early 2000s. It was originally created by Dean Malone.
At the first glance, it may look a bit complex, but the TDI is simply the result of combination of four following forex indicators:
- RSI (green line);
- Moving Average for signals (red line);
- Bollinger Bands with a setting of 34 and a Standard Deviation using the Fibonacci golden ratio number of 1.6185 (blue volatility bands);
- Moving Average set to 34 (yellow market baseline).
The main idea behind TDI was to give traders a full picture of the current Forex market situation.
How to apply TDI in trading?
Trading Rules Explanation
Signals provided by the Traders Dynamic Index Indicator are really intuitive and easy to understand. Simply follow the suggestions below.
Buy Entry: Open long trade when the market baseline value is above 50 level and the green line crosses above the red line. Place your stop loss a few pips below the last swing low.
Sell Entry: Open short trade when the market baseline value is below 50 level and the green line crosses below the red line. Place your stop loss a few pips below the last swing high.
Exit Trade / Take Profit: Close your open position when the RSI exceeds 68 level (for buy) or 32 level (for sell). You can also use important support/resistance level or the opposite signal.
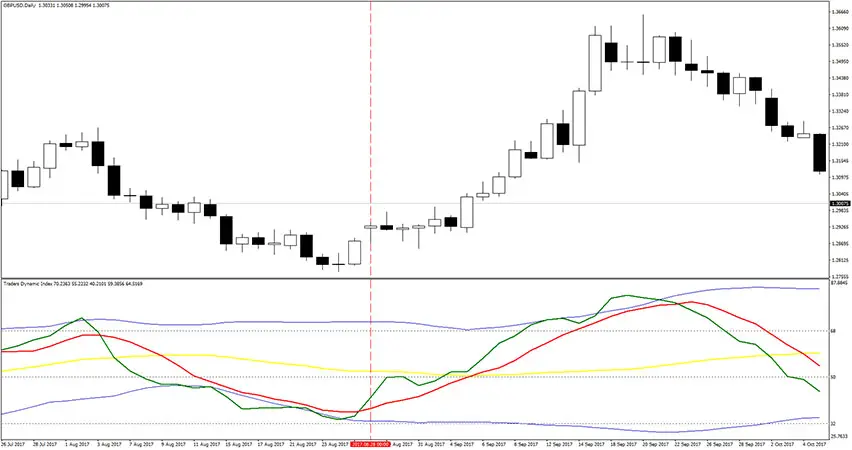
Example of GBP/USD D1 Chart
This screenshot below shows an example of the Traders Dynamic Index Indicator in action.