VWAP Indicator MT4
Platform: MT4 Type: Trend Last update: August 3, 2026The VWAP Indicator for MT4 stands for Volume Weighted Average Price. It shows the average price of a currency pair, weighted by trading volume, giving you a more accurate read than price alone.
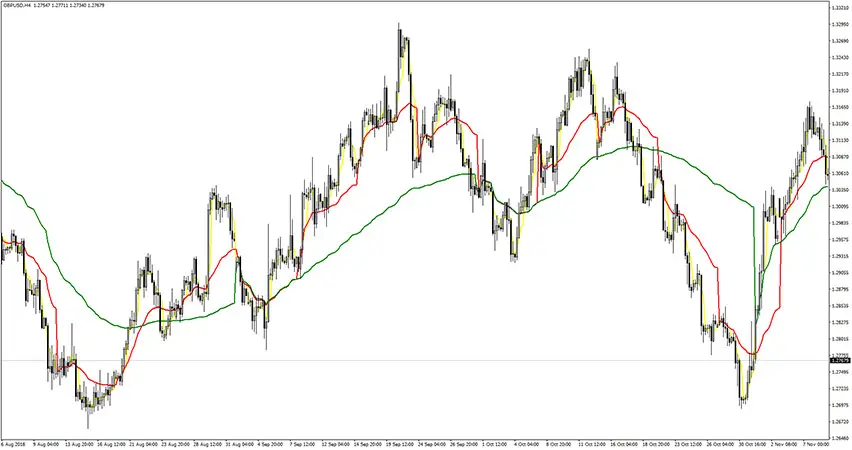
It works like a adaptive moving average, but many traders prefer it because it factors in volume. This version displays three colored lines: monthly, weekly, and daily.
How to use the VWAP Indicator for MT4?
Signals from this indicator are simple to read, and the strongest ones occur when the monthly and weekly lines cross.
Trade in the direction of the underlying trend.
The trend is bullish when the weekly line (red) moves above the monthly line (green), and bearish when it moves below.
While VWAP doesn’t offer pinpoint entries, look for opportunities when price sits near the weekly line (red) and on the correct side of the daily line (yellow): below it for longs, above it for shorts.
For a buy trade, set your stop loss below the last swing low. For a sell trade, set it above the last swing high. In both cases, aim for at least a 1:2 risk-to-reward ratio on your take profit.
If you want more precise entries, pair VWAP with a dedicated entry-point tool like the MBFX Timing indicator.


More details about VWAP
VWAP vs Moving Average
Traditional moving averages are based on closing prices, so they reflect where price ended up.
VWAP instead plots a continuously updating average weighted by volume, which many traders see as a more reliable read on price action since it accounts for how much trading actually happened at each level, useful for confirming trends, reversals, support and resistance, and breakouts.
Formula
VWAP is calculated as:
VWAP= ∑Typical Price * Volume / ∑Volume
The typical price is the average of the High, Low, and Close for a given period.
Multiply that by volume for the same period, then take the running (cumulative) total of both typical price × volume and volume separately. Dividing the cumulative TP x V by the cumulative volume gives you the VWAP for that period.
The calculation looks complex, but the indicator handles it automatically. All you see on the chart are the resulting lines.