VWAP Oscillator Indicator MT4
Platform: MT4 Type: Oscillator Last update: August 1, 2026The VWAP Oscillator Indicator for MT4 measures price movement relative to the volume-weighted average price. It plots two lines – daily and weekly, that oscillate around a zero level.
It’s built to help you spot overbought and oversold conditions, momentum shifts and potential reversals.
How to use the VWAP Oscillator Indicator for MT4?
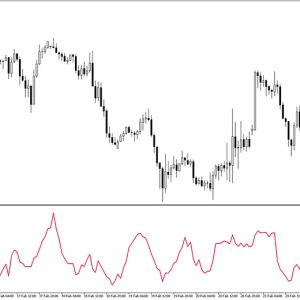
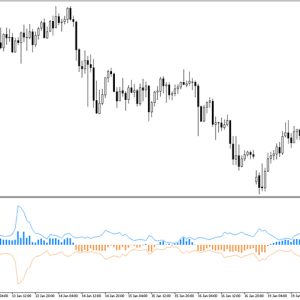
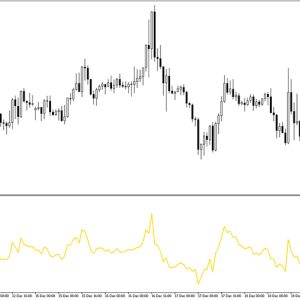
The indicator displays two lines in the dedicated window below main trading chart: red and yellow. They represent daily and weekly VWAP data.
Signals are triggered when these lines cross. When the yellow line moves above the red line, the trend is bullish. When yellow moves below red, the trend is bearish.
The zero line adds extra confirmation.
When the oscillator is above zero, it shows that price is trading above its VWAP. When it is below zero, price is trading below its VWAP. This helps confirm the direction of the trend. The farther the oscillator moves away from zero, the stronger the signal.
Example trade:

As you can see on the GBP/USD H1 chart above, the yellow line crossed below the red line. The price dropped shortly after, confirming the signal.