MACD Histogram with Filter MA Indicator
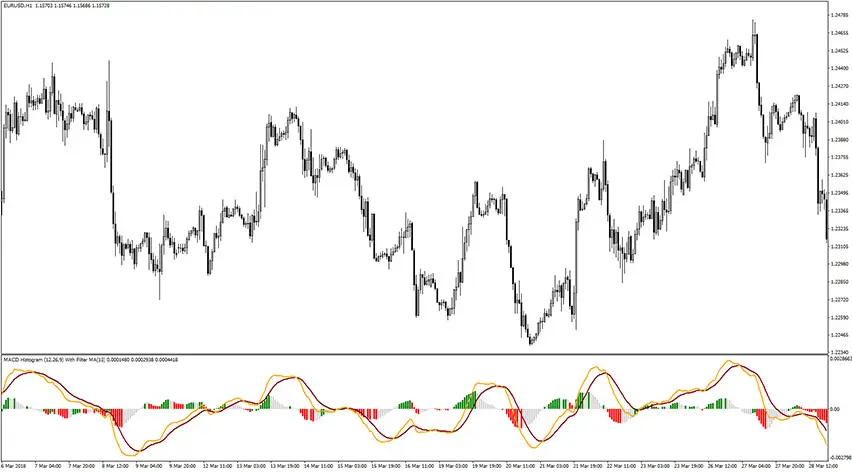
Platform: MT4 Type: Momentum Last update: August 18, 2026The MACD Histogram with Filter MA Indicator for MT4 combines the MACD Histogram with a Moving Average filter, giving you both trend direction and clearer entry and exit signals in one tool.
Example chart:
How to use the MACD Histogram with Filter MA Indicator for MT4?
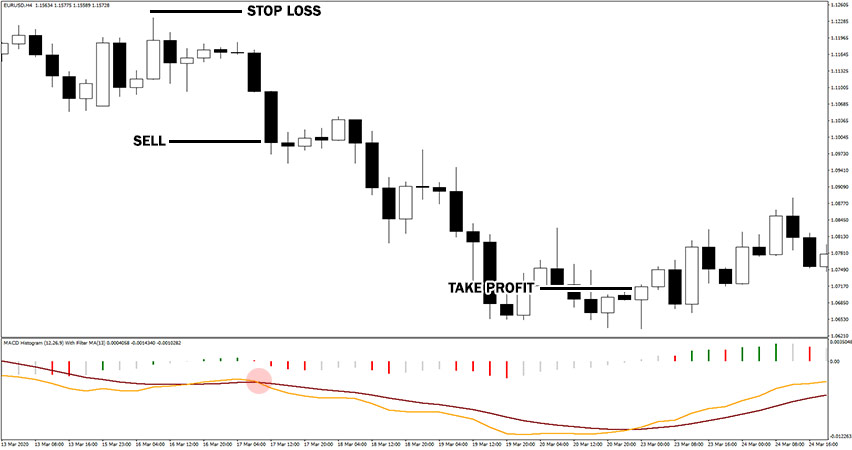
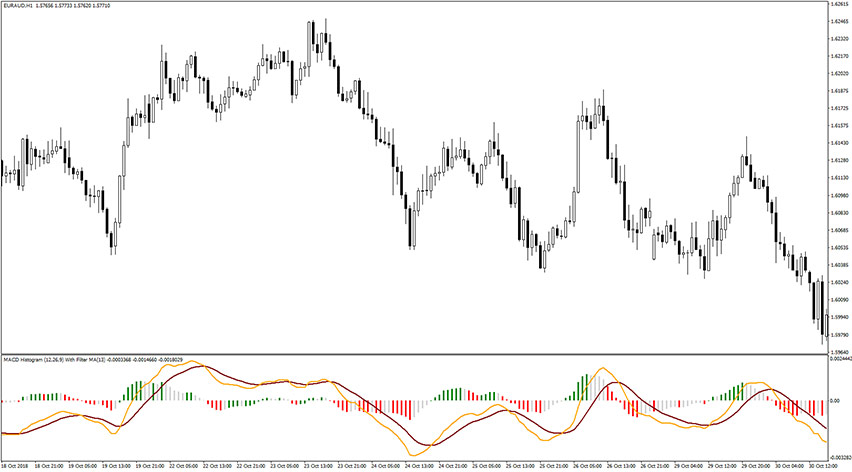
The indicator plots two moving averages: orange (fast) and dark red (slow), alongside a color-coded histogram. Together, they help you catch trend-momentum shifts and also accurate entry and exit points.
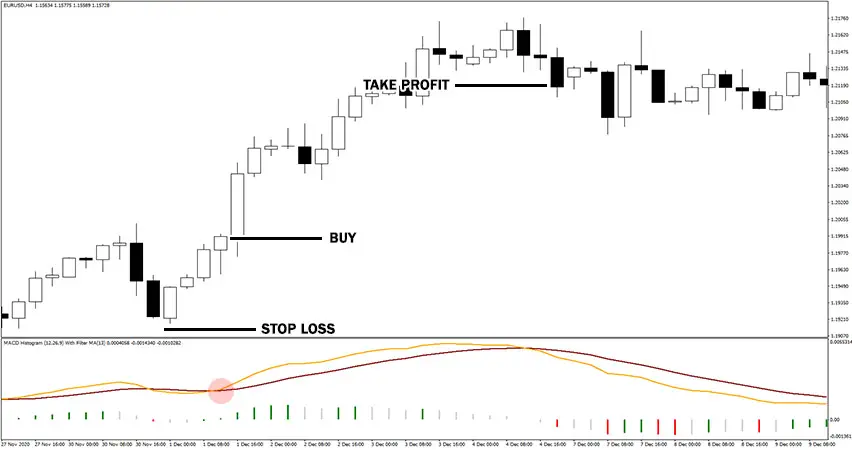
A bullish setup takes place when the histogram moves into positive territory and the orange MA crosses above the dark red MA.
Once these conditions line up and a bullish price pattern confirms the move, you can enter a buy trade. Place your stop loss a few pips below the most recent market low.
Hold the position until the opposite crossover appears or exit using your own preferred method.
This EUR/USD H4 chart shows as example of long trade.
A bearish setup mirrors this: the histogram drops into negative zone and the orange MA crosses below the dark red MA.
Again, with a bearish price pattern confirming the move, you can enter a sell trade. Set your stop loss a few pips above the most recent market high.
This EUR/USD H4 chart shows as example of short trade.