SSL Channel Chart Indicator MT5
Platform: MT5 Type: Channel Last update: July 25, 2026The SSL Channel Chart Indicator for MT5 is a trend-following tool that helps you identify the direction of short-term momentum.
It plots two lines based on a modified set of moving averages, with the space between them shaded to show trend direction.
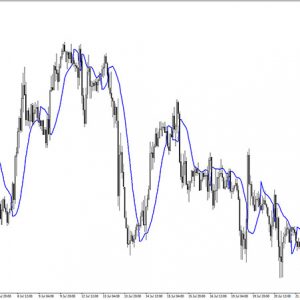
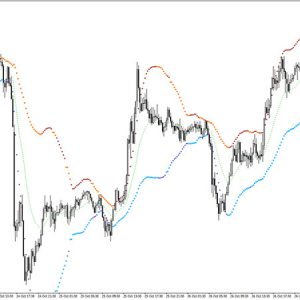
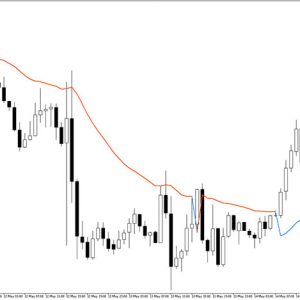
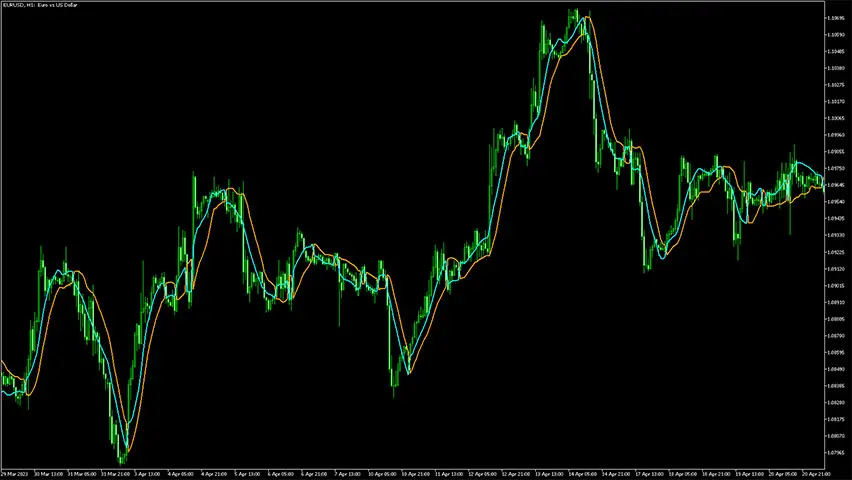
Example chart:

How to use the SSL Channel Chart Indicator for MT5?
The core of the SSL Channel Indicator is a pair of orange and aqua lines that signal bullish and bearish trends.
A buy signal triggers when the aqua line crosses above the orange line. Place your stop loss at the previous swing low and use the opposite signal (or your preferred risk-reward ratio) to set your profit target.
A sell signal triggers when the aqua line crosses below the orange line. Place your stop loss at the previous swing high, using the same approach for your profit target: either the opposite signal or a risk-reward ratio you’re comfortable with.

Additional tips
This indicator works across timeframes, from short-term charts like M15 and H1 to longer ones like daily and weekly. Keep in mind that signals on lower timeframes appear more often but don’t always mark the start of a strong trend.
Multi-timeframe analysis works best here. Use higher timeframes to spot the overall trend, then drop to lower ones to adjust entries in that same direction.
Stay extra cautious near support and resistance levels. Price often tends to react more sharply there.
Summary
The SSL Channel Indicator for MetaTrader 5 earns its reliability from a simple core: moving average crossovers that are easy to read and flexible enough to fit different trading styles. Try it on its own first, then layer in other tools as you build out your strategy.