TMA Centered Bands Indicator MT5
Platform: MT5 Type: Channel Last update: December 6, 2025The TMA Centered Bands Indicator for MT5 creates a dynamic channel formation with one central line and two dotted bands. This guage uses color-code for clarity: the top is pink, the bottom is blue, and the middle one shifts between pink and light blue to reflect trend changes.
Example chart:

How to use the TMA Centered Bands Indicator for MetaTrader 5?
The best strategy to use with the TMA Centered Bands indicator is reversal trading, however the color of middle line defines the direction of ongoing trend.
As the trend evolves, the price moves between the bands and each price-band touch offers a trading opportunity – additionally marked by buy and sell arrows. Then an reversal is likely to happen.
Statistically, price moves back to the middle line much more frequently compared to the opposite band, so this is a good take profit target. The key is analysis of price action patterns (to confirm an reversal) and discipline in managing trades.
Real-life examples
Take a look at this EUR/AUD H1 chart.
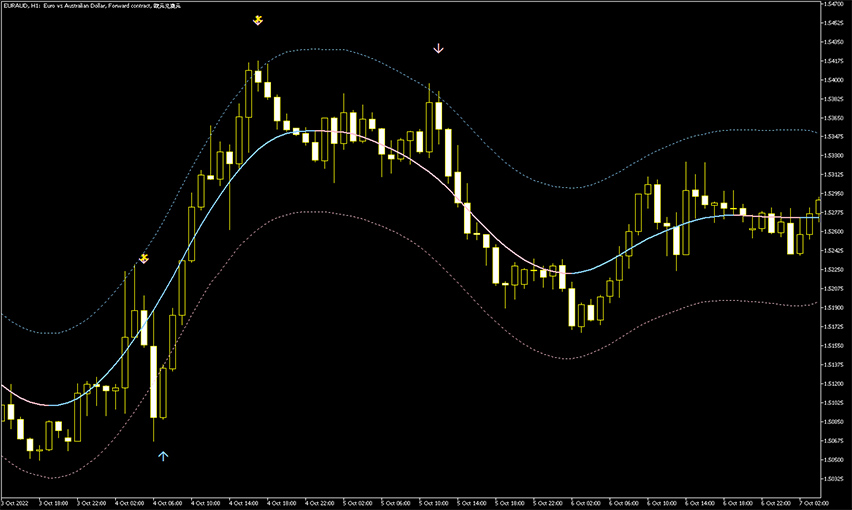
As you can see, there were two sell opportunities (and earlier one buy).
Each setup offered a good risk-to-reward ratio if entered at the candle highlighted by the arrow, but none of them reached the opposite band. This only confirms the approach the middle line is excellent spot to close trade. Traders can also try two TP levels and partial closing on occassions.
Formula behind the TMA centered bands
When it comes to the formula used, it’s built on triangular moving averages – they give the bands their characteristic smooth and balanced shape.
Submit your review | |