MT5 Kairi Relative Index Indicator
Platform: MT5 Type: Oscillator Last update: February 12, 2026The Kairi Relative Index Indicator for MT5 analyzes price movements and helps traders spot exhaustion and pullback opportunities.
Behind the scenes, it calculates how far price has stretched away from moving average and displays dedicated oscillator line.
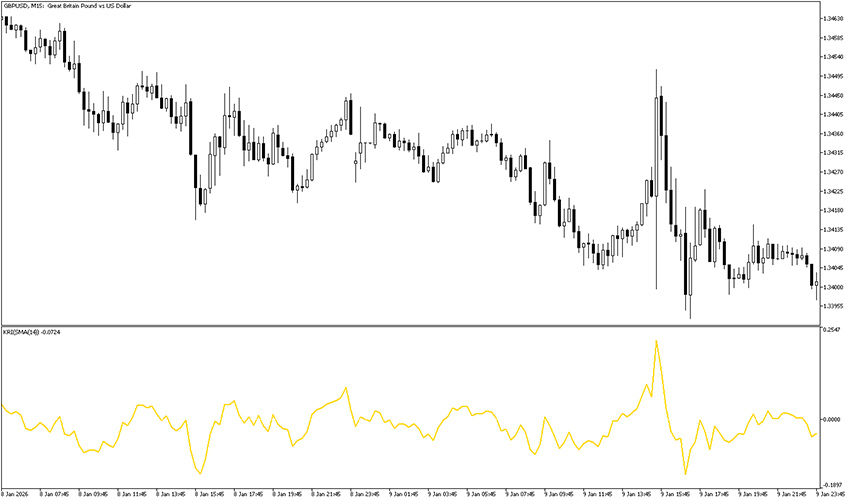
Example chart:
How to use the Kairi Relative Index Indicator for MT5?
The Kairi Indicator measures how far price has deviated from its moving average, expressed as a percentage. In other words, it shows when the market is stretched, overextended or ready for mean reversion.
Fun fact: Kairi in Japanese means separation or distance.
Because markets tend to revert toward their average, extreme distances often signal:
- exhaustion
- pullbacks
- reversals
- short-term corrections
When there are extreme positive readings, traders should consider short setups. Conversely, in case of extreme negative it’s good to look for long setups.
However, Kairi is not only for reversals. Note that during strong trends, the oscillator may stay on one side for long periods.