TMA CD Divergence Indicator MT5
Platform: MT5 Type: Reversal Last update: February 14, 2026The TMA CD Divergence Indicator for MT5 is responsible for detecting divergences between price and Triangular Moving Average. Traders receive high-probability trend reversal signals and momentum shifts.
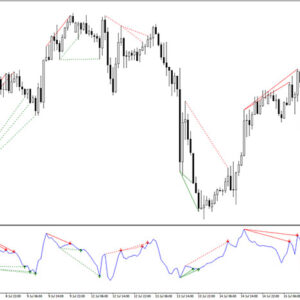
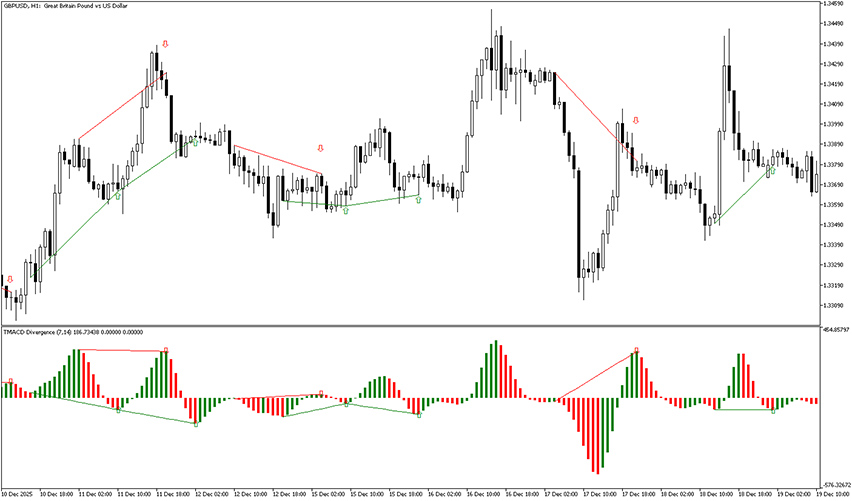
Example chart:
How to use the TMA CD Divergence Indicator for MT5?
Once the indicator is activated in MetaTrader 5 platform, it displays colored histogram bars and buy sell arrows.
Green rising bars reflect increasing momentum, and conversely, red decreasing bars suggest momentum is fading.
The most important elements are upward and downward arrows paired tilted lines that appear when a divergence is formed. Traders should take advantage of provided opportunities in the direction of generated arrow.
On the other hand, this TMA indicator should not be used on its own only. Instead, it should be used in the context of market structure and the distance from support and resistance levels. It is also a good idea to use it in conjunction with a trend indicator, e.g. moving average, and avoid counter-trend trades.
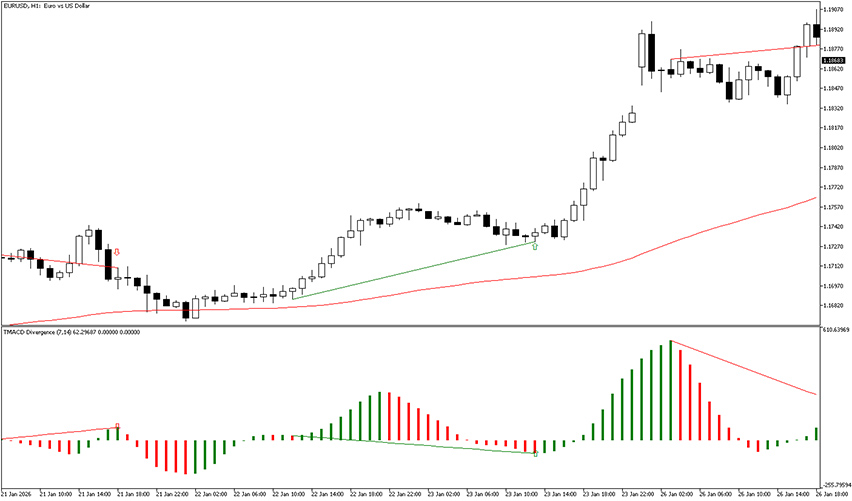
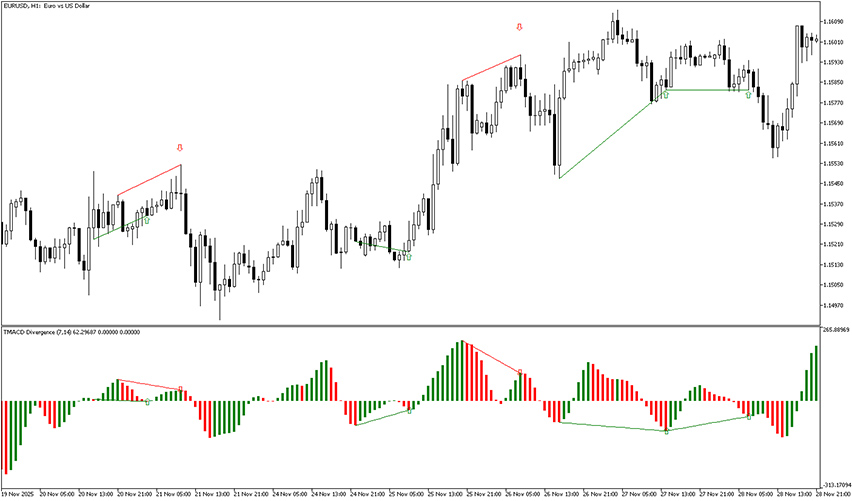
Example trade
Take a look at the above EUR/USD H1 chart.
We have added 100-period Exponential Moving Average to TMA CD Divergence. As you can see, there was one counter-trade signal and one in agreement with trend. The first one was risky with limited profit potential and the second one gave excellent risk to reward ration.