KAMA Indicator MT5
Platform: MT5 Type: Trend Last update: September 21, 2026The KAMA Indicator for MT5 is a moving average that adapts to market conditions.
It reacts faster when the market is trending. It slows down when the market is choppy or moving sideways.
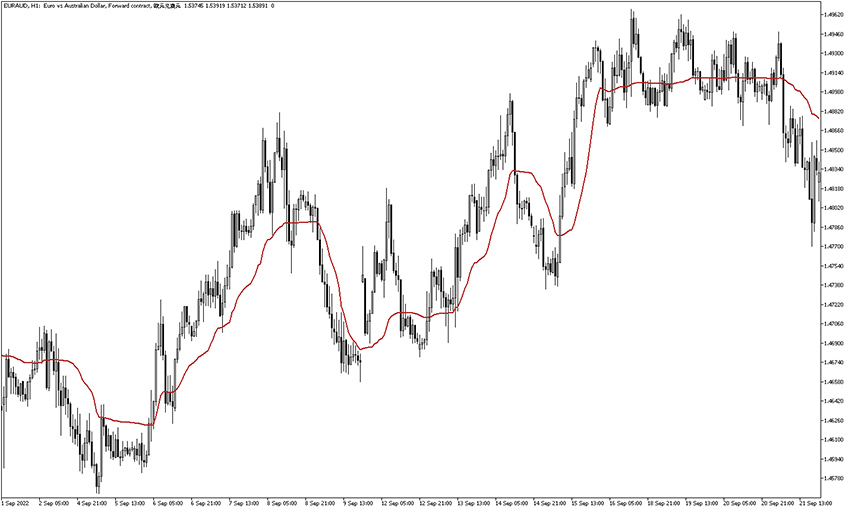
Example chart:
How to use the KAMA Indicator for MT5?
As a rule of thumb – price staying above the KAMA line generally indicates a bullish bias and price staying below it suggests a bearish bias.
KAMA can also be used as a dynamic support or resistance level.
For this purpose, traders often use a longer period than the default setting, with 100 being a common starting point.
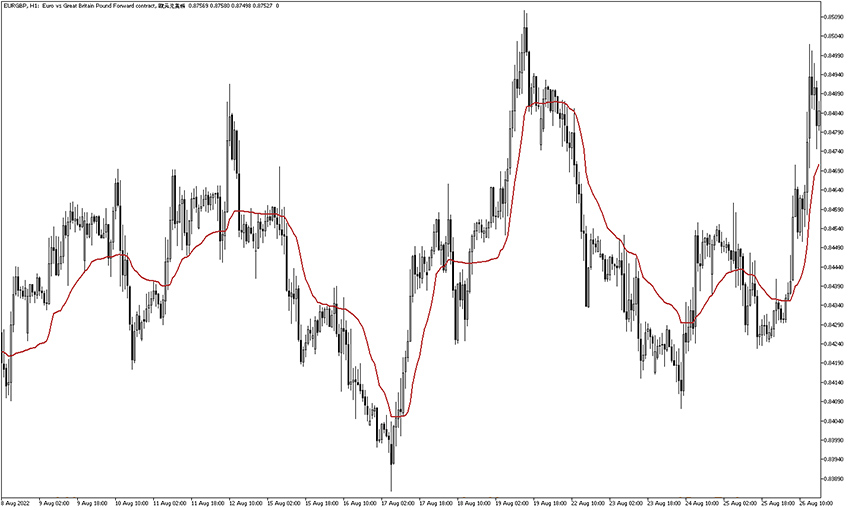
As you can see on the EUR/GBP H1 chart above, the KAMA line closely follows price during sharp moves.
However, it flattens during quieter, directionless periods, a direct result of its adaptive behavior.
Formula
KAMA is calculated as:
KAMA[i] = KAMA[i-1] + sc × (Price[i] – KAMA[i-1])
Where sc, the smoothing constant, is derived from er (the efficiency ratio): sc = (er × 0.6015 + 0.0645)², and er = |Price[i] – Price[i-Period+1]| / Sum1, with Sum1 being the sum of absolute price changes over the chosen period.
What does KAMA mean?
KAMA stands for Kaufman Adaptive Moving Average.
Perry J. Kaufman created this indicator and introduced it in his 1995 book, Smarter Trading: Improving Performance in Changing Markets.
Settings
Two inputs control the calculation.
First, the period defines the lookback length. Second, the applied price determines which price value (close, open, high, low, etc.) feeds into the formula.
Since both are adjustable from the input tab, it’s worth testing different values to match your preferred pair and trading style.