MACD 2 Line Indicator MT5
Platform: MT5 Type: Momentum Last update: October 25, 2025The MACD 2 Line Indicator for MT5 is an enhanced version of this classic momentum indicator and it has two lines that form a cloud. This change makes it easier to visualize crossovers that reflect potential short-term trend reversals.
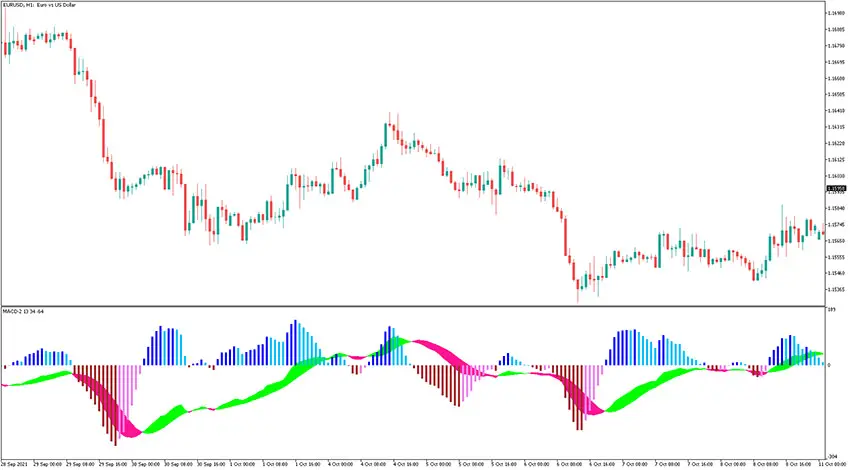
Example chart:
How to use the macd 2 line indicator for mt5?
The macd 2 line indicator provides trading signals based on four colorful elements that fall into two distinct groups. In order to use it effectively one needs to undertand these elements and what do they reveal.
Cloud
The main part is the cloud, which shows trend direction. A green cloud suggests an expected upward movement and a pink cloud points to possible downward momentum.
When a change in the cloud’s color happens, it’s a signal that merket sentiment is shifting.
Histogram bars
The second group to take into account is the histogram bars. They reflect the strength of buying or selling pressure.
Strong buying momentum is highlighted in a dark blue color. On the other hand, light blue tells about potential reversal or consolidation pariod.
Similarly, dark brown bars represent powerful selling pressure. Light pink bars suggest that bearish momentum is weakening and a change in trend may be approaching.
Real-life trading examples
In the following examples, we have used the 2-line macd in conjunction with a 100-period exponential moving average to determine the overall trend direction. The idea behind this approach is to avoid counter-trend trades as these are risky.
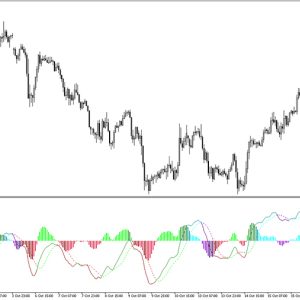
Take a look at this EUR/USD M5 chart.
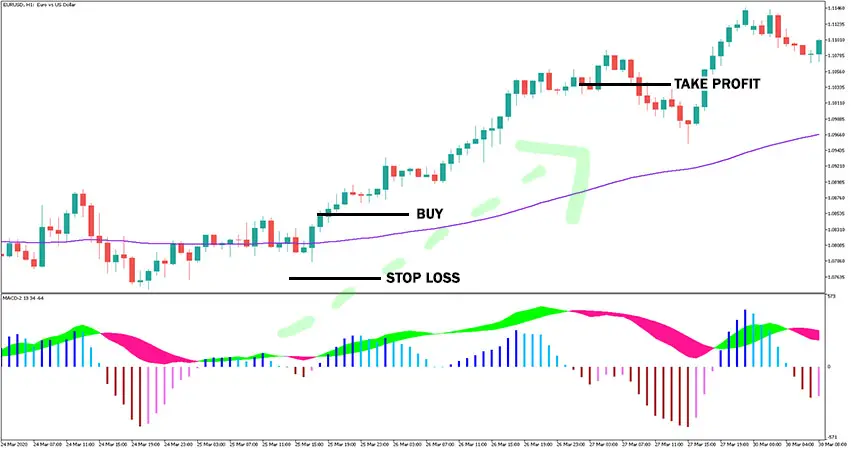
In the left section of the chart, the market was moving sideways for some time before the moving average began to slope upward (signaling the start of a potential uptrend). Once the cloud turned green and the histogram shifted to dark blue, it provided an ideal entry point for a long trade.
This trade setup offered a 1:2 risk-to-reward ratio, with the stop-loss placed just a few pips below the most recent swing low.
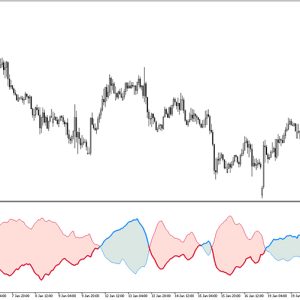
This is another EUR/USD M5 chart.
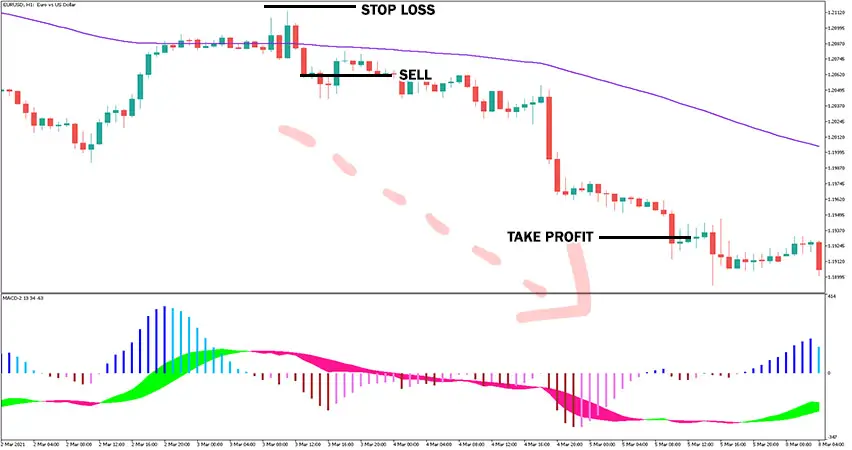
This time there was clean downward trend.
As you can see, a brief pullback occured, but ultimately the price resumed its decline. This scenario was confirmed by the appearance of a pink cloud on the indicator. The alignment between trend direction and macd 2 line signal provided a strong confirmation for a short trade.
Submit your review | |