RSI TMA Centered Bands Indicator MT4
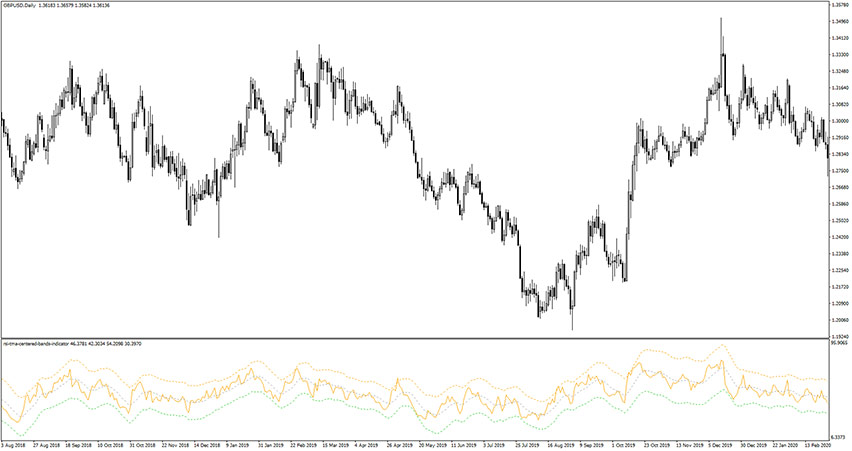
Platform: MT4 Type: Channel Last update: February 21, 2026The RSI TMA Centered Bands Indicator for MT4 combines Relative Strength Index and TMA Bands into one trading tool. These two elements work great together and define overbought and oversold levels accurately.
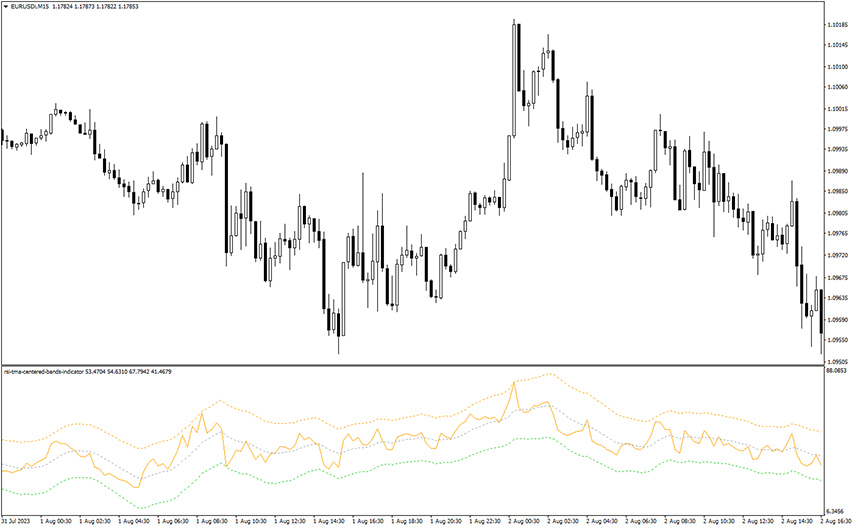
Example chart:
How to use the RSI TMA Centered Bands Indicator for MT4?
A trader should look for buy trade opportunities when the CCI is below the middle line of the TMA. Similarly, sell trade opportunities occur when the RSI is above the middle line of the TMA.
Especially look for reversal opportunities when CCI oscillator moves outside TMA band as this is a very extreme level.