Absolute Strength Oscillator
Platform: MT4 Type: Oscillator Last update: September 21, 2024The Absolute Strength Oscillator measures two main forces driving the markets: bulls and bears. In other words, it shows whether the dominant players are buyers or sellers. The very moments these forces change are visible in a crossovers between two lines repesenting both parties. Le’ts analyze this tool in more details.

The anatomy of absolute strength indicator for mt4
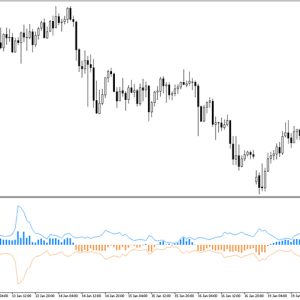
Once you active it in your MetaTrader 4 platform, you will notice two distinct lines displayed within a window placed below main activity chart. The goal of this gauge is to plot absolute strength of price action of given asset – behind the scenes it performs mathematical calculations to generate the best possible readings.
It’s designed to give clean visual clues, thus can be successfully used both by beginners and more advanced forex traders. What’s more, it’s a no repaint indicator, so can be definitely trusted more and can be considered more reliable.
Signals explained
When it comes to understanding the provided signals, it’s crucial to know the following. Buyers are represented by a green line, and similarly, sellers are represented by a red line. The market bias depends on which line has higher values. If green one – the setup is bullish, if red one – the scenario is bearish.
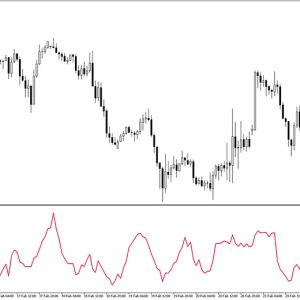
GBP/JPY H4 chart showing bulls in control

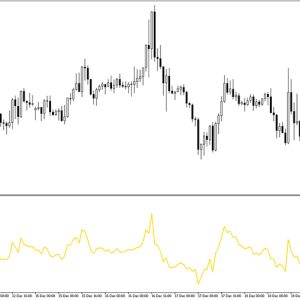
AUD/CAD H4 chart showing bears in control