Ahoora Oscillator Indicator MT4
MT4 Oscillator TradingFree DownloadThe Ahoora Oscillator Indicator MT4 is a colored buy and sell technical oscillator and it’s available to free download. The forex indicator shows a signal line that changes color between red and green, indicating the direction of the trend-momentum.
Sounds interesting? Let’s take a closer look at it.
Introducing the Ahoora Oscillator Indicator
MT4 Indicator Overview
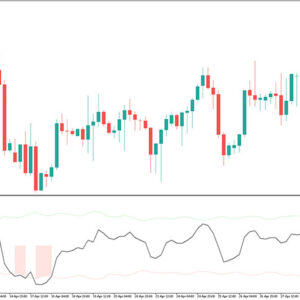
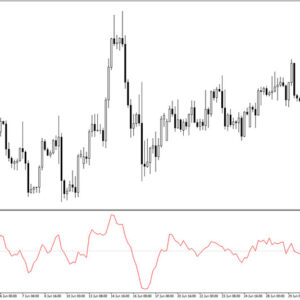
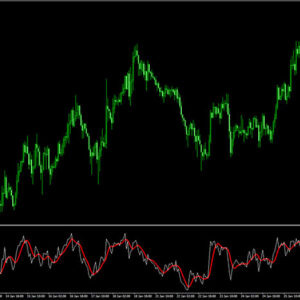
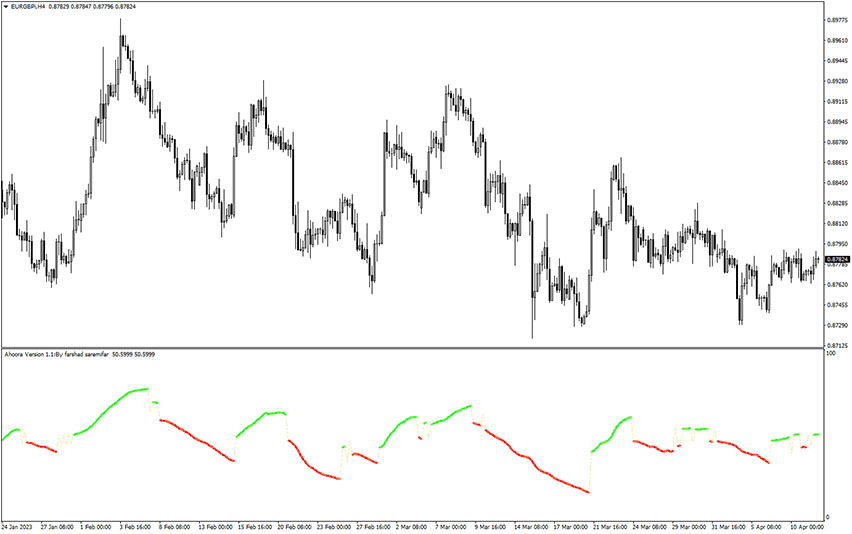
The download link of the Ahoora Oscillator MT4 indicator is placed at the bottom of this post. Once you’re done, your trading chart should look similar to the example below.
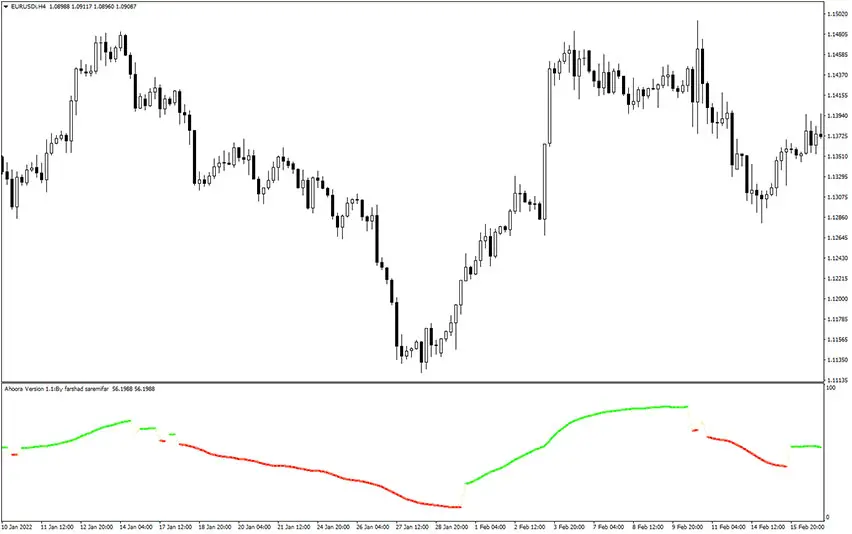
That forex MT4 indicator uses two extreme values, 0 and 100, to determine oversold and overbought markets. When the oscillator approaches the 0 value, it indicates that the market is oversold. Similarly, when it approaches 100, it suggests that the market is overbought.
The oscillator generates a colored signal line, which can be either green or red. A green line suggests that the oscillator trend is upward, indicating a bullish market, while a red line suggests that the oscillator trend is downward, indicating a bearish market.
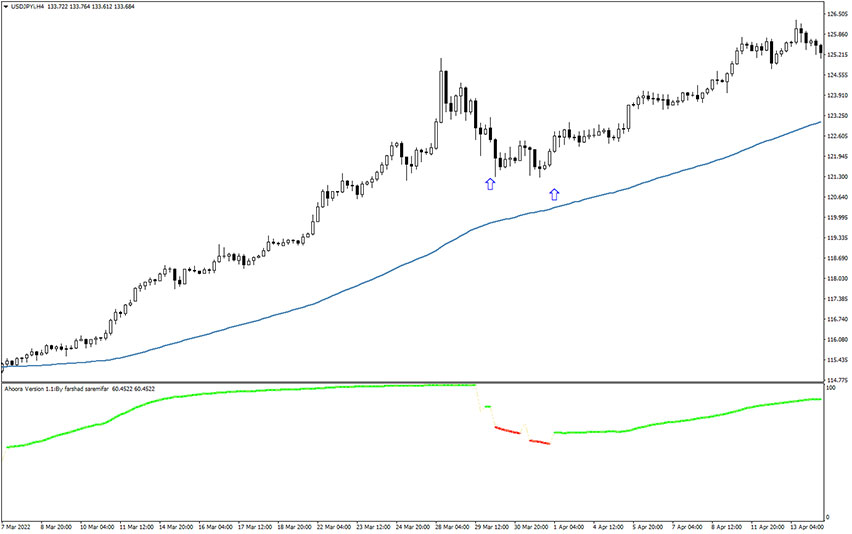
To maximize the effectiveness of this gauge, it’s best to use it in conjunction with a trend trading indicator like the 100 period MA or 89 period EMA. Traders should take the Ahoora oscillator signals only in the direction of the overall trend to avoid false signals and maximize profitability.
Settings
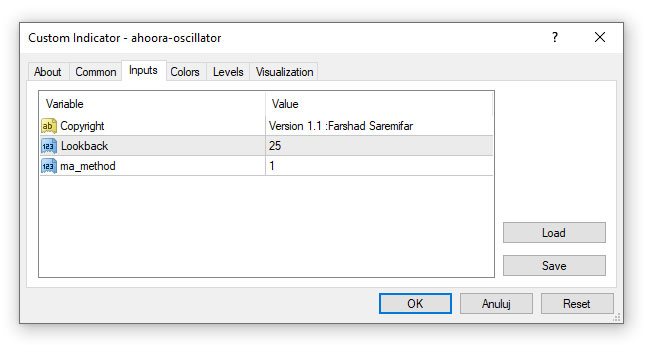
When it comes to settings, I prefer to set the Ahoora oscillator’s “lookback” period to 100 instead of the default value of 25, as it reduces the occurrence of false signals to a significant extent. To adjust this value, simply navigate to the indicator’s inputs tab.
How to set up that MT4 indicator in your trading platform?
Installation Guide
Download the ahoora-oscillator-indicator.rar archive at the bottom of this post, unpack it, then copy and paste the ahoora-oscillator.ex4 or ahoora-oscillator.mq4 indicator files into the MQL4 folder of the Metatrader 4 trading platform.
You can gain access to this folder by clicking the top menu options, which goes as follows:
File > Open Data Folder > MQL4 > Indicators (paste here).
Now go to the left side of your MT4 terminal. In the Navigator find the gauge name, right-click it and select Attach to the chart.
Conclusion
The MT4 Ahoora Oscillator Indicator signals are easy to interpret, with a simple buy trade signal indicated by a color change from red to green, and a sell trade signal indicated by a color change from green to red. Trades can be closed when an opposite signal occurs, or traders can use their own exit strategy. Keep in mind that market conditions and money management skills also have a huge impact on trading success.
Download Free Forex Ahoora Oscillator MT4 Indicator
To download the Ahoora Oscillator Indicator for Metatrader 4 (MT4) for free just click the button below:
Ahoora Oscillator Indicator Free Download
