Automatic Trendlines Histogram Indicator
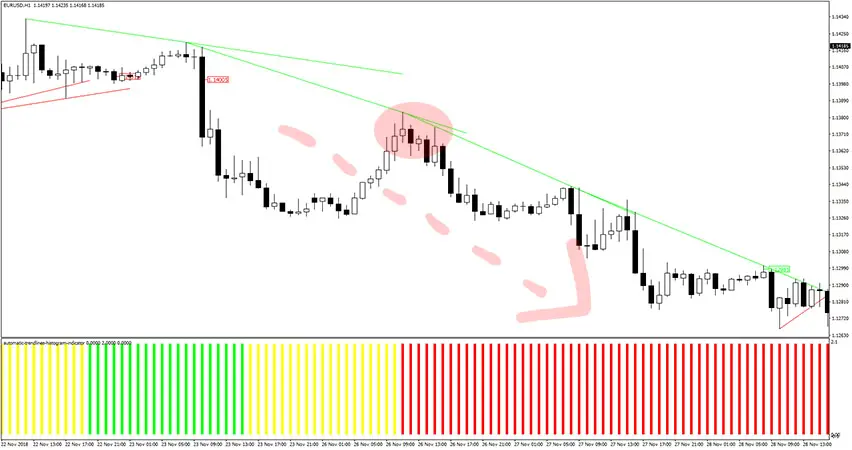
Platform: MT4 Type: Trend Last update: September 28, 2024The Automatic Trendlines Histogram Indicator for MT4 works in two fields simultaneously. It draws automatic trendlines and displays trend histogram bars at the same time. The auto trendline is your dynamic support and resistance levels, while trend oscillator (histogram) comes in handy as a trend direction filter.
How to use the automatic trendlines histogram?
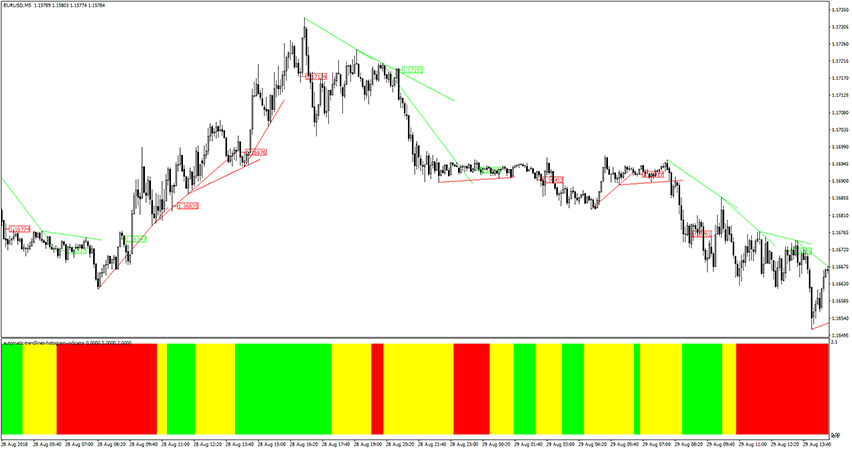
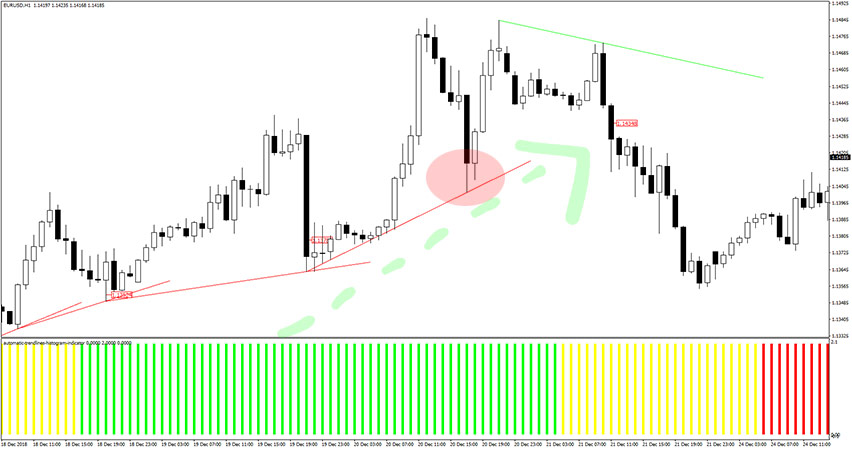
The Automatic Trendlines Histogram Indicator spots the market highs/lows and connects them to draw the trendlines. You can notice two colors of these trendlines: red trendlines work for upward movements and green trendlines work for downward movements. Similarly, green histogram bars reflect a bullish trend, and red histogram bars reflect a bearish trend. Detailed trading instructions are provided below.
Buy Signal
Follow these steps for a long trade:
- Trend histogram provides green bars
- There is a red trendline and price touches it and rejects it
- Price swings higher from recent low swing
- Buy trade is triggered after the above conditions are met
- Set stop loss a few pips below the last swing low of the market
- Take profit or exit whenever you get risk-reward ratio above 1:1 or use your own method of trade exit
Sell Signal
Follow these steps for a short trade:
- Trend histogram provides red bars
- There is a green trendline and price touches it and rejects it
- Price swings lower from recent high swing
- Sell trade is triggered after the above conditions are met
- Set stop loss a few pips above the last swing high of the market
- Take profit or exit whenever you get risk-reward ratio above 1:1 or use your own method of trade exit