Momentum Histogram Indicator
Platform: MT4 Type: Momentum Last update: December 7, 2024The Momentum Histogram Indicator for MT4 provides traders clean representation of present and past momentum of chosen asset. This is displayed in the form of histogram bars, which helps determine the strength and potential direction of market’s trend. It can be utilized both as swing and trend-following trading tool. Let’s check more details about it.
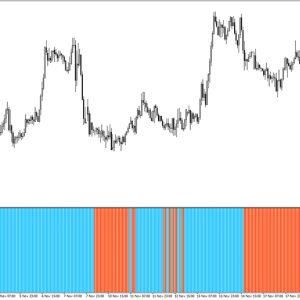
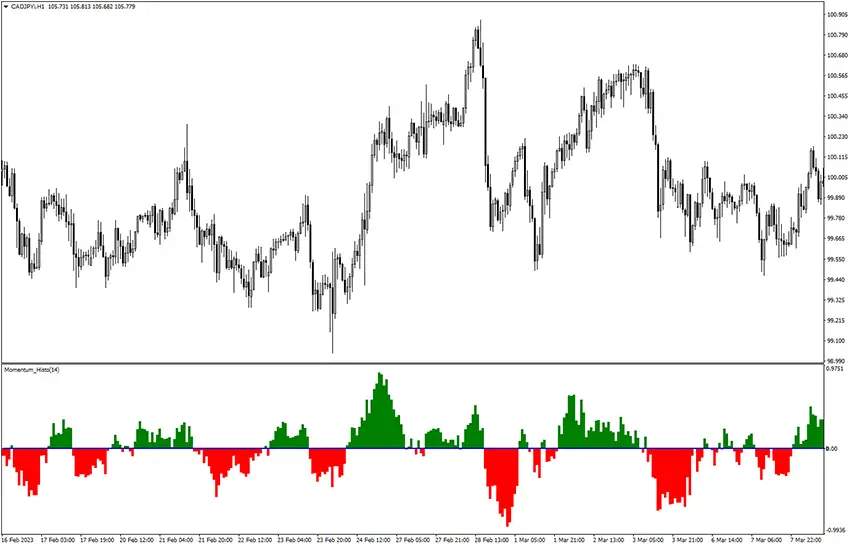
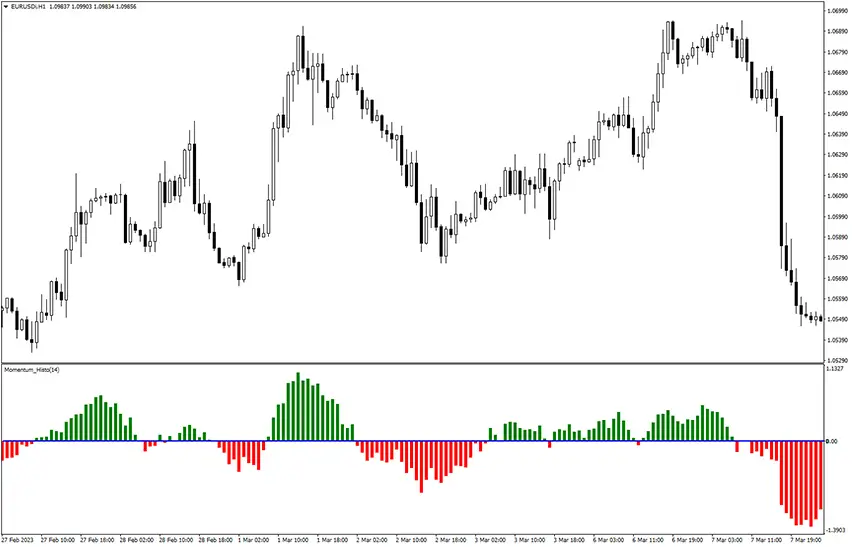
First, let’s get familiar with it looks – once you activated, you should see similar chart to the example below.
Tips on operating this momentum histogram tool
This indicator is proven to give pretty effective identification of short term buy/sell signals. As a core principle, it operates on fluctuations in relation to zero level (blue horizontal line). The readings above it suggests bullish price movement, additionally confirmed by green bars. On the contrary, when a bearish bias takes place, it’s validated by red colored histogram.
As you can see, the interperation is not causing much trouble as it’s easy and straightforward.
Normally entries would be triggered at switch from negative to positive (and vice versa), however this approach would result in many fakeouts. There must be some additional confirmators onboarded.
For example, it may be a moving average to determine overall direction, then also account price action patterns. What’s more, trade only during hours of main sessions so there is enough volatility. That way you will have much better success rate.
Summary
Although this is basic gauge, it can be still useful. It just focuses on a part of bigger picture and it’s rather recommended to combine it with other technical analysis indicators instead using it as standalone tool. You can build reliable strategy and it can be a great foundation for momentum-related aspects.
Submit your review | |