QQE Histogram Indicator MT5
Platform: MT5 Type: Momentum Last update: December 29, 2025The QQE Histogram Indicator for MT5 is an enhanced version of the QQE technical indicator, but it has several interesting features added. This tool introduces discontinued signal line levels to provide more insights into the trend.
What’s more, it also includes color-changing histogram bars that correspond to these mentioned levels. As always, free download is available.
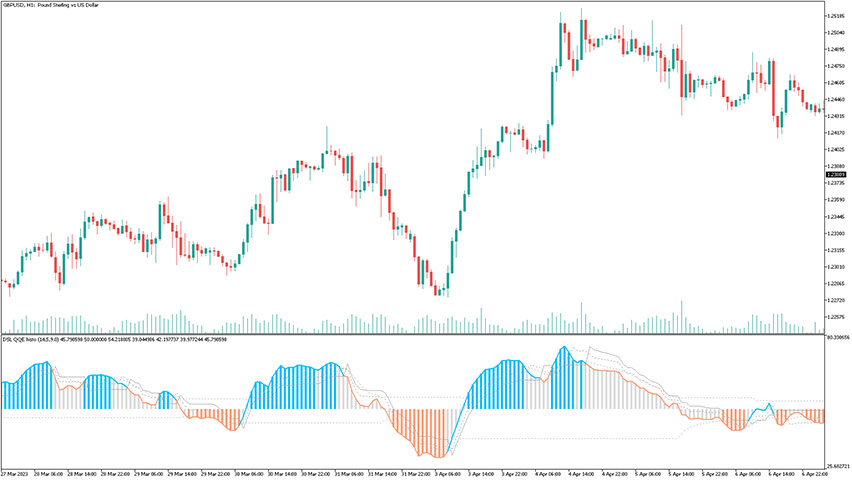
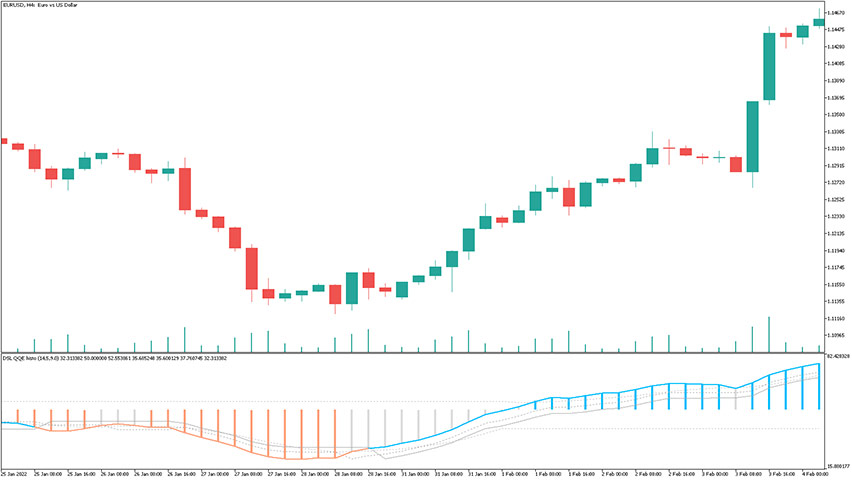
Below you can see an example chart in MetaTrader 5 platform.
What makes the QQE histogram stand out?
So the standard Quantitative Qualitative Estimator is made of:
- smoothed relative strength index
- two trailing levels based on fast and slow volatility
This version also has the above features, but what makes the QQE histogram special is that its buy/sell signals are based on color changes of the readings. Let’s take a look on how to utilize these signals effectively.
How to use the QQE histogram indicator for MT5?
Follow these suggestions when trading with the QQE Histogram as a standalone tool.
Buy Signal: Initiate a long position when the dark gray line of the QQE histogram intersects the ascending blue line from the bottom.
Sell Signal: Initiate a short position when the dark gray line of the QQE histogram crosses the descending light orange line from the top.
Exit buy trade: Close all buy orders if, during a bullish trend, the light orange line falls below the 50.00 level.
Exit sell trade: Close all sell orders if, during a bearish trend, the blue line rises above the 50.00 level.
Bottom line
This MetaTrader 5 indicator is a great choice for forex traders that wants to quickly get signals for any timeframe or currency pair. Thanks to improved formula it detects trend direction and momentum more accurately. It can be sucessfully used alone or even better with other technical analysis tools – consider the Keltner Channel or the SSL indicator.