Buy Sell Pressure Indicator MT5
Platform: MT5 Type: Oscillator Last update: June 29, 2025The Buy Sell Pressure Indicator for MT5 is designed to measure momentum by analyzing the balance between buying and selling pressure in the market.
While it may appear simple at first glance, this indicator delivers meaningful insights that go beyond standard oscillators.
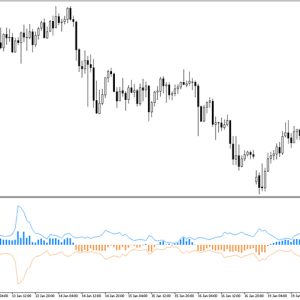
Example chart:

How to use the buy sell pressure indicator for mt5?
After activation of the indicator, we advise to change the default settings. Namely, let’s change the pressure filter to both pressures. In the result, it will display two seperte lines corresponding to these two forces, which is obviously much better approach then a default singular line readings that can be a little ambigous.
Another recommendation is changing the smoothing period value to 12, but feel free to test other values as well. Thanks to this, the trends are less interlacing.
Once everything is in place, you should see two lines – a green one and a red one. They reflect buy and sell pressure respectively.
Trading signals interpretation
- Bullish signal – occurs when green line shows a continuous rise in buying pressure. This suggests the beginning or continuation of an uptrend. Traders should consider long trades only.
- Bearish signal – converesely, happens when red line highlights an consistent increase in selling pressure or a decline in buying pressure. Traders should take advantage of short trade opportunities with this setup.
Typically, an early entry point is after an crossover of the signal lines. It’s smart to combine this tool with other forex indicators for even better performance (e.g. trend indicators like moving averages).
The chart belows shows a clean scenario of dominating buy pressure.

Should you use overbought and oversold levels?
Since the indicator’s scale is dynamic and adjusts to the market environment, fixed overbought or oversold zones are not really practical. Instead, observe how the lines behave relative to past movements and recent volatility for better analysis.
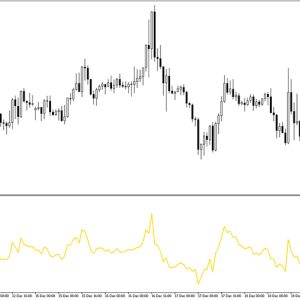
Example of growing selling pressure
Take a look at the EUR/AUD H1 chart.
You can notice how the red line crosses above the green one, signaling that sellers are gaining control. This shift often precedes significant downward price movement, as shown in this case.

Indicator settings
The indicator supports five customizable options:
- period – defines the number of bars used for calculation buying (higher values translate to smoother readings)
- smoothing period – sets the length of smoothing applied
- smoothing method – determines the type of smoothing (simple, exponential, smoothed, linear weighted)
- pressure filter – selects which pressure type to display (buying, selling, prevailing, both)
- smoothing filter – controls smoothing application (both, only smoothed, only unsmoothed)
Bottom line
Understanding whether buyers or sellers dominate the market is key to making informed trades. The buy sell pressure indicator for metatrader 5 gives a clear visual representation of that balance, helping you anticipate momentum shifts and act accordingly.
What’s more, this is a perfect candidate to use in conjunction with various technical analysis indicators in order to confirm ideas.

Submit your review | |