Buy Sell Volume Indicator MT5
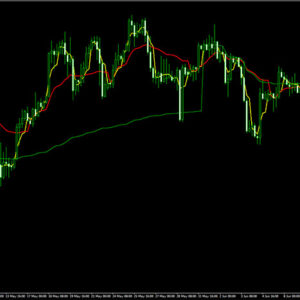
Platform: MT5 Type: Volatility Last update: November 30, 2025The Buy Sell Volume Indicator for MT5 provides bullish and bearish volume readings, based on relation between price and its average. Its readings are based on channel formation containing histo bars with a baseline in the middle.
The X-axis represents time accounting interval such as 1-hour, 4-hour, or daily period. The Y-axis displays the volume values, with positive values corresponding to buy activity and negative values corresponding to sell activity. This separation around the zero baseline helps differentiate pressures that drive the market.
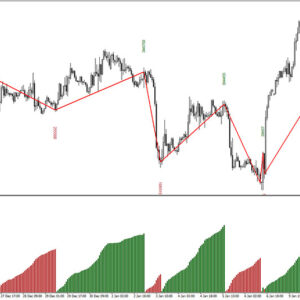
Example chart:

Explaining signals of the buy sell volume mt5 indicator
When it comes to understanding provided signals, the overall meaning is the following:
- If the price is above the average, it signals a “buy” trend, and the volume shown is in green color.
- If the price is below the average, it signals a “sell” trend, and the volume shown is in orange color.
This indicator allows customization with options like tick and real volume, average methods and period, timeframe (it’s mtf gauge), alerts and more. Depending on needs, it’s possible to make the readings smoother or more sensitive.

Submit your review | |