Category: Market Levels Indicators
Daily Pivot Points Indicator
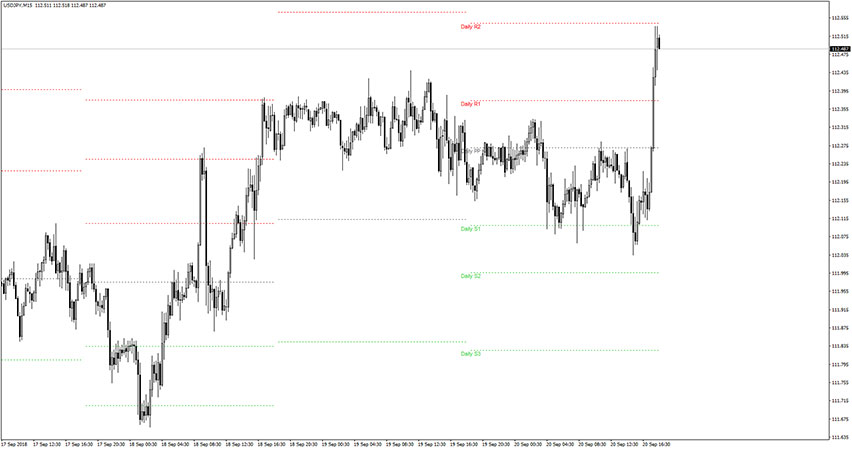
The Daily Pivot Points Indicator draws horizontal lines that act as daily pivot levels R3, R2, R1, Pivot, S1, S2 & S3. These values of the Daily Pivot Points Indicator are calculated on a custom formula of an average of significant prices (high, low, close) of the previous trading session. You will have all these […]