Category: Oscillator Indicators
PCCI Indicator
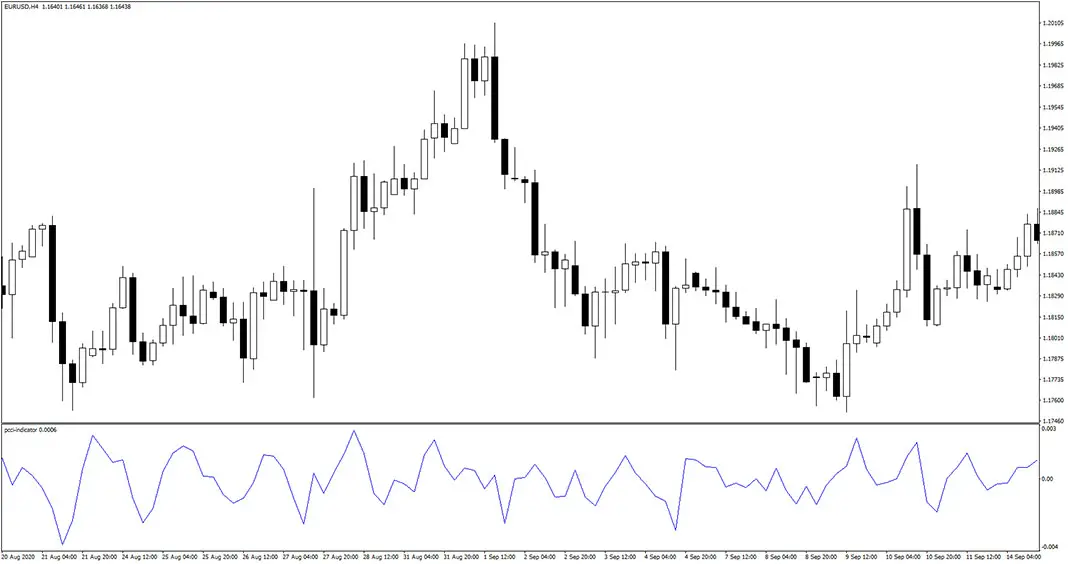
The PCCI Indicator is a custom forex technical analysis tool that calculates the difference between the closing price of a period and its statistical expectation. You should look for buy trades when the indicator rises above the zero level. Take a look at higher timeframes charts to confirm the bullish trend. Similarly, look for sell […]
Advanced Get Oscillator Indicator

The Advanced Get Oscillator Indicator is a custom technical analysis tool that consists of oscillator bars and two bands. The indicator is displayed just below the main trading chart in the form of a histogram that fluctuates above and below the zero level. Values above zero level reflect a bullish trend, while bars below zero […]
Wildhog Indicator

The Wildhog Indicator for MT4 is a custom forex oscillator that shows an overbought/oversold market levels. What’s more, it’s capable to automatically recognize and draw classical and hidden divergences (all customizable in the settings tab). The potential entries are marked with buy/sell arrows directly on the activity chart. It’s a good condidate to use in […]
TRSI Indicator
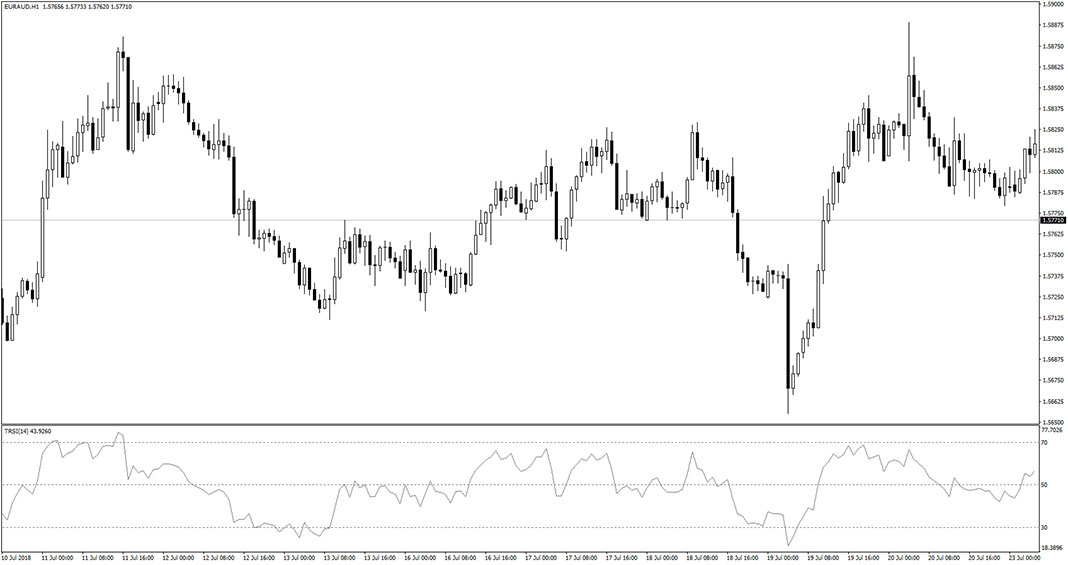
The TRSI Indicator for MT4 is an oscillator that essentially consists of the EMA, SMA, and RSI. The goal of such combination is improved recognition of overbough and oversold market states. Trading Rules Explanation Buy Entry: When the signal line reaches 30 level and below. The price should reverse from now and you should be […]
RSI Peak Valley Levels Indicator
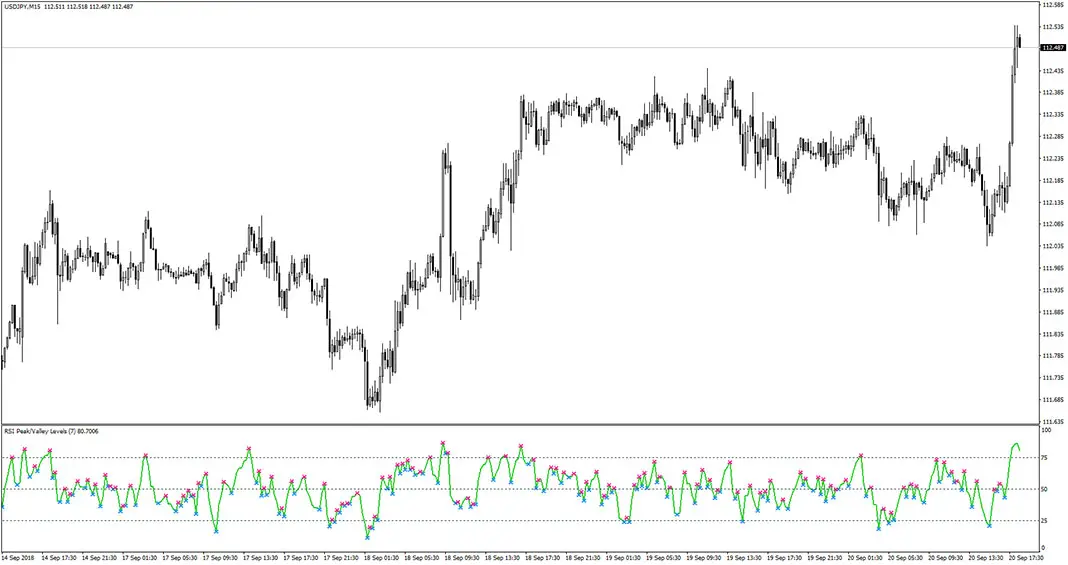
The RSI Peak Valley Levels Indicator for MT4 is responsible for marking all tops and bottoms of the Relative Strenght Index. These points are useful to undestand when the price reaches overbought or oversold zone. Another use case is to connect these dots in order to draw divergence line. Example chart:
STO JMA Indicator
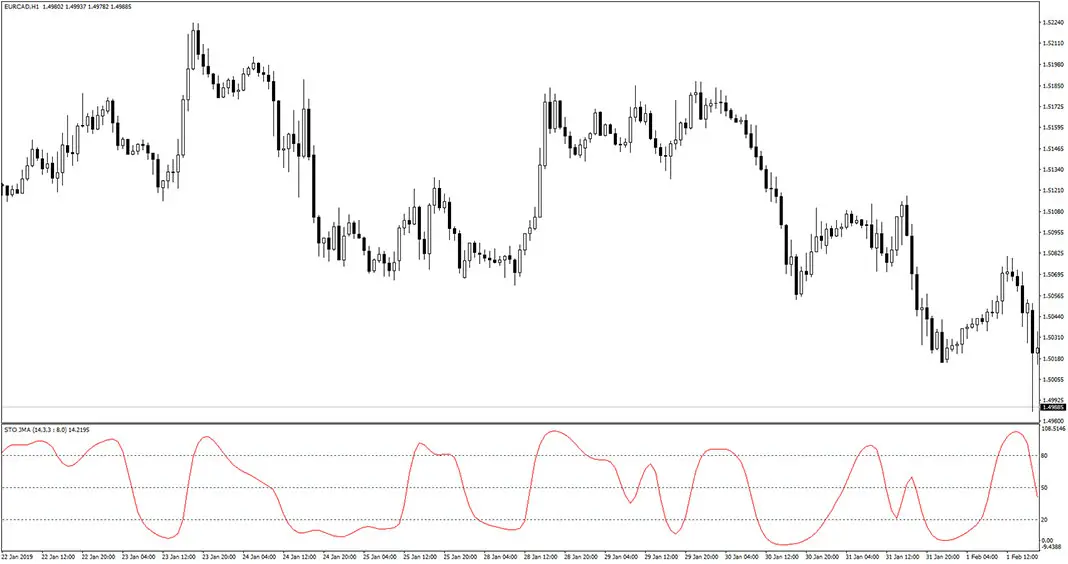
The STO JMA Indicator for MT4 is a custom forex oscillator. Like all oscillators, this one also shows overbought and oversold market levels. When that signal line reaches below 20 level, it means the price is oversold and you should be looking for a buy trade opportunity. Similarly, when the oscillator line reaches above 80 […]
COG RSI Indicator
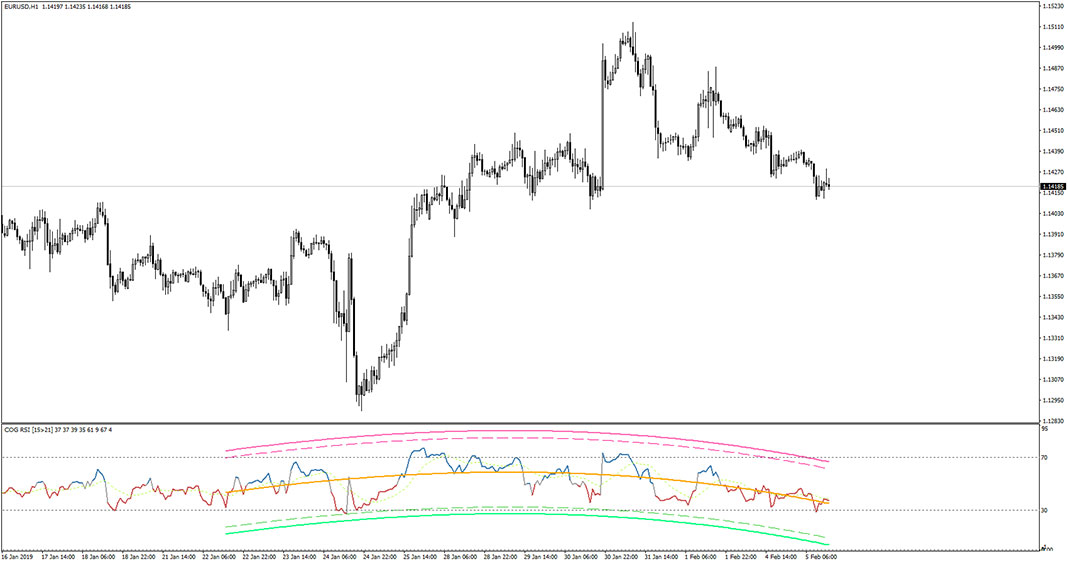
The COG RSI Indicator is, as the name suggests, a forex trading tool based on the Center of Gravity and Relative Strenght Index (RSI). The indicator is displayed in a sub window placed just below the main trading chart. This tool uses overbought and oversold market levels to generate trading signals, that are triggered when […]
BB Stops RSI Super Smooth Indicator
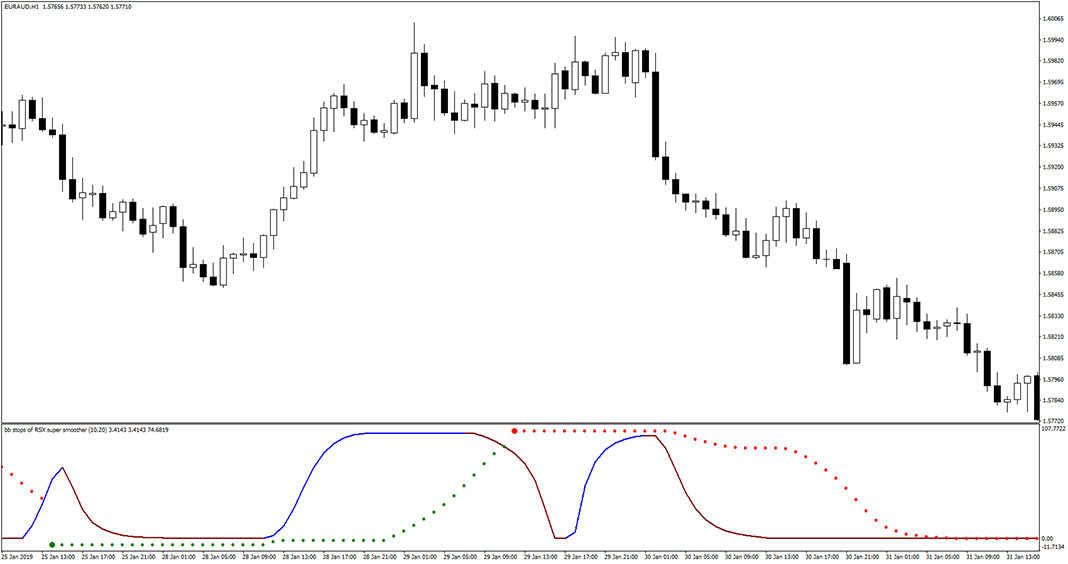
The BB Stops RSI Super Smooth Indicator for MT4 constis of two elements: solid oscillator line and a dotted bands. Both are displayed within same window. In order to enter a trade both readings should be in agreement. It means for a long signal smoothed rsi should turn blue and bb stops should turn green. […]
DAT WPR Indicator
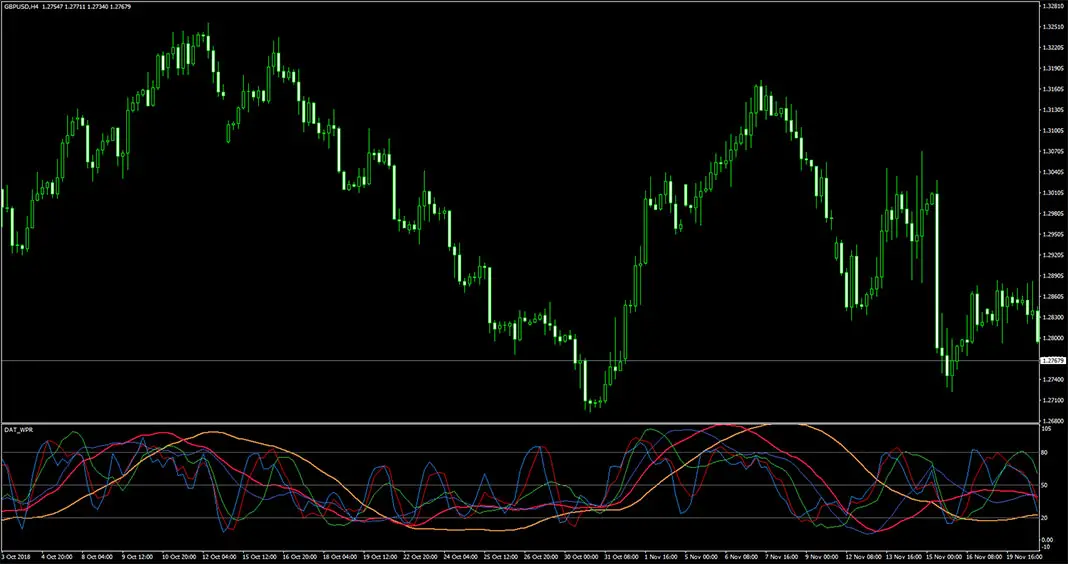
The DAT WPR indicator is a forex gauge based on the Williams’ Percent Range. It provides multiple oscillators that determine whether the price is overbought/oversold. The most important lines are the orange one and the pink one. When they reach 80 level it means the market is overbought and the potential reversal is underway, so […]
ZZI Indicator
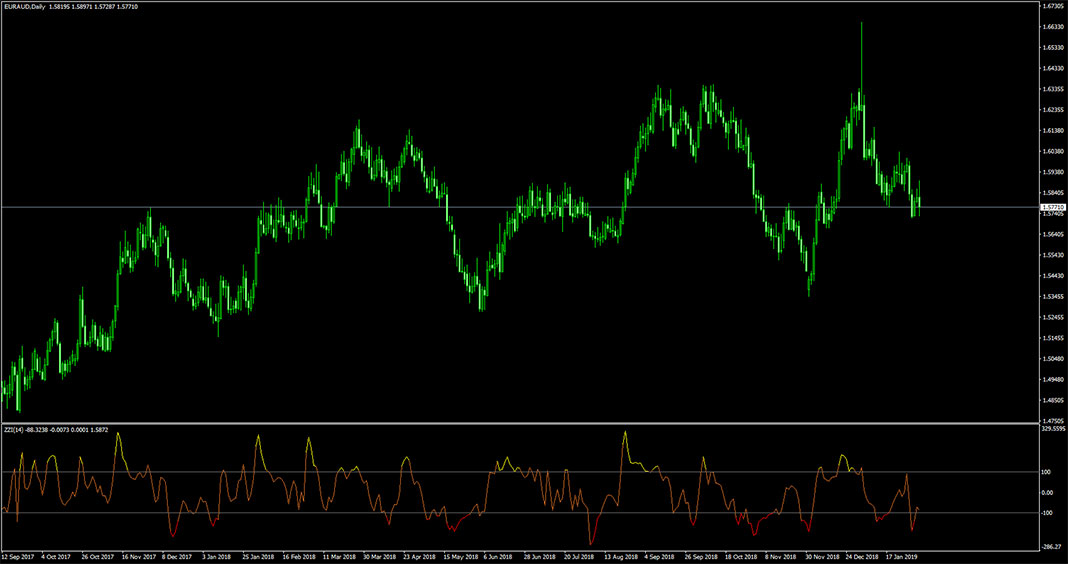
The ZZI indicator for MT4 is an oscillator useful for determining trade entry and exit points. Tyically, it recognizes an oversold/overbought market state. When it exceeds the 100 level, it means the price is overbought. You can open a sell trade when the signal line turns yellow. Similarly, when it drops below the -100 level, […]