CCI Histogram Indicator
Platform: MT4 Type: Oscillator Last update: January 17, 2025The CCI Histogram Indicator for MT4 displays the readings provided by the Commodity Channel Index in the form of histo bars instead regular oscillator line. This approach allows for more friendly recognition of buy sell trends as well as overbought and oversold levels.
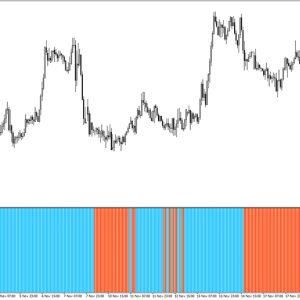
Example chart:

How to use the cci histogram mt4 indicator?
Once you activate the indicator in your trading platform you will see series of blue and red columns with different height and some leaning to the top and some to the bottom. Additionally there is a red moving average line as well.
All these setups come with a specific meaning, namely they correspond to bullish, bearish and flat conditions, which are reliably highlighted. What’s more, it’s capable of catching reversals too.

The indicator has a really large variety of customization options. Among many, one can change timeframe (it supports multi timeframe analysis), cci period, price type (high, low, heiken ashi…), ma method (exponential, smoothed, simple…) or display of buy sell arrows.


Final words
As you can see, this is a powerful tool that can be highly adjusted to meet the needs of many traders and various strategies. It can also be successfully paired with other technical gauge to provide double-confirmation of trade ideas.
Submit your review | |