CCI of EMA Indicator MT5
Platform: MT5 Type: Oscillator Last update: June 20, 2025The CCI of EMA Indicator for MT5 displays an oscillator line which takes additional colors after reaching overbought or oversold zones.
Essentially, this is a hybrid technical analysis tool that blends the Commodity Channel Index with an Exponential Moving Average.
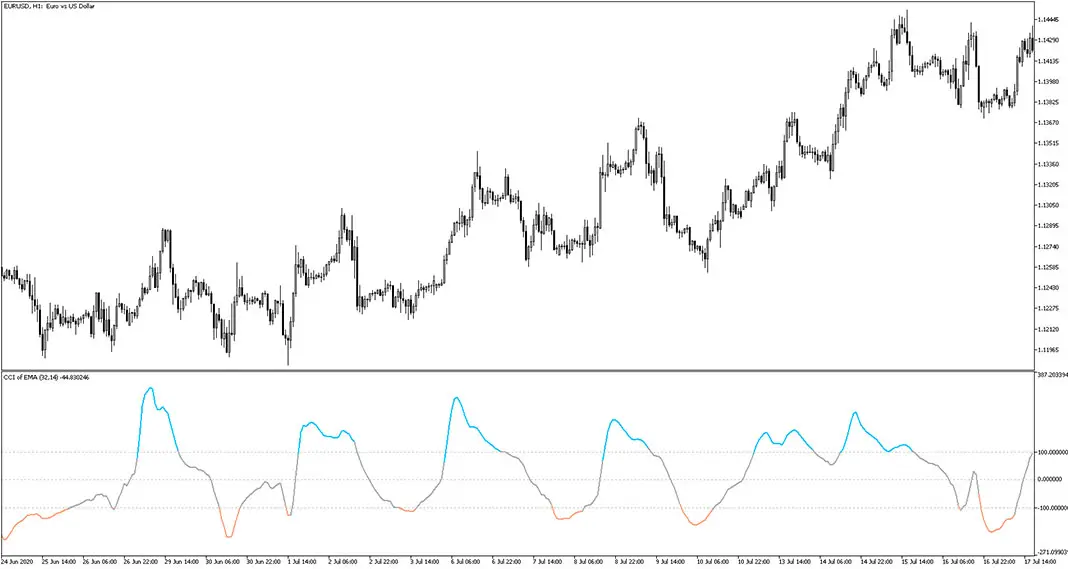
Example chart:

How does the cci of ema indicator for mt5 work?
Normally, the CCI is applied to price to measure its deviation from the statistical mean.
In this case, the indicator applies the CCI calculation to an EMA rather than to raw price data. This produces a momentum oscillator that evaluates how far the EMA itself diverges from its own average behavior, providing a smoothed view of price momentum.
While the EMA is default option, users can also choose between MA, SMMA and LWMA.
How to use provided signals?
The main signal line changes color depending on market situation. What’s more, there are two horizontal dotted lines at +100 and -100 that define the overbought and oversold thresholds respectively. These levels are used to identify potential reversal points or momentum breakouts.
There are three triggers for color change: levels crossing (default choice) or zero crossing or slope change.
When oscillator turns blue, it means a strong bullish momentum. Conversely, when it turns orange, it suggests strong bearish momentum. The gray color represents a neutral or consolidating phase.
Take a look at the AUD/JPY H1 chart. You will notice how the price reversed each time the oscillator entered the colored zone.

Indicator settings
In the settings tab, there are 6 customizable inputs.
- CCI period – the number of bars used to calculate the CCI of the selected average.
- Average period – the length of the moving average applied before CCI is calculated.
- Average method – the type of moving average (EMA, MA, SMMA, LWMA) to use.
- Price – the price type (close, open, high, low, etc.) on which the moving average is based.
- Levels – the threshold values (e.g., ±100) for overbought and oversold zone.
- Color change type – the condition (level crossing, zero crossing, slope change) that triggers a color shift in the oscillator line.
Submit your review | |