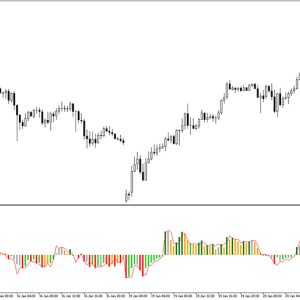
COG RSI Histogram Indicator
Platform: MT4 Type: Oscillator Last update: November 3, 2024The COG RSI Histogram Indicator for MT4 is a combination on the Center of Gravity and Relative Strenght Index with additional display of histogram bars.
In essence this also is an oscillator, so it reveals an overbought and oversold market conditions. What’s more, there are COG bands plotted within the indicators window and their tilt is important.
How to trade?
When it comes to trading rules, it is as follows. When the readings hits an oversold area (below -20 level), and the COG bands slope is upward – you should be looking for buy trades. Similarly, When the readings hits an overbought area (above 20 level), and the COG bands slope is downward – you should be looking for sell trades.
Example chart:

Submit your review | |
ForexRacer
Average rating: 0 reviews