Fan RSI Indicator
Platform: MT4 Type: Oscillator Last update: December 14, 2024The Fan RSI Indicator for MT4 falls into the category of trend momentum oscillators. In essence, it plots multiple Relative Strength Index lines within a single chart. It comes in handy if a trader wants to recognize trends early on and therefore benefit from trading first pullbacks of these emerging trends. Let’s deep dive into working with that gaige as it can be utilized with various strategies.
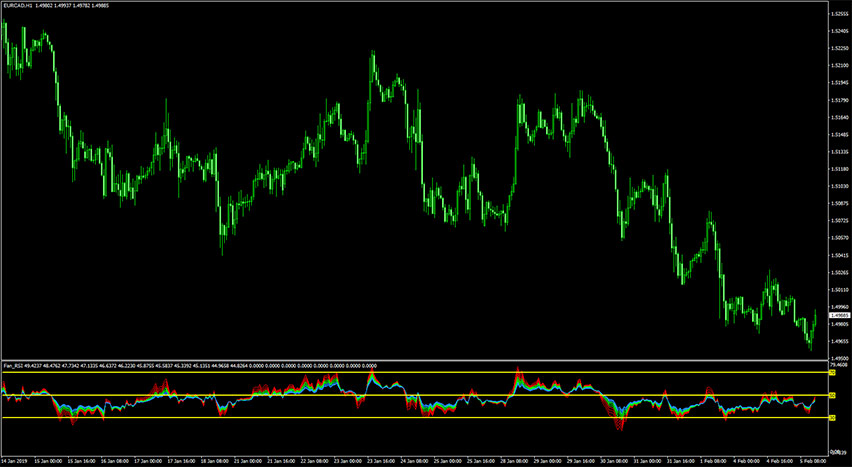
Example chart
Understanding the fan rsi indicator for mt4
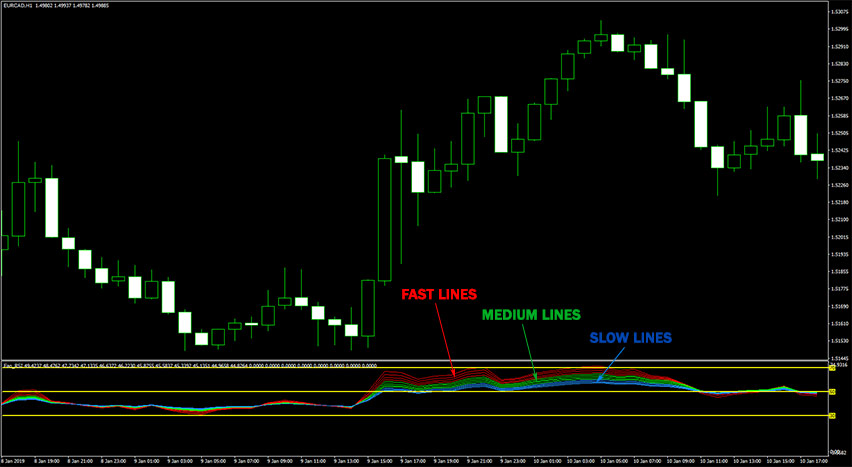
The Fan RSI consists of multiple signal lines colored red, lime, and blue. Each color has a specific meaning.
Red colored lines represent a shorter period and fast reaction to price fluctuations, lime is a medium period, and blue colored lines are slowly and smoothly reacting to price changes and they constitute a longer period.
When the red lines are aligned above the other two, it means the trend momentum is considered bullish. On the contrary, when these fast red lines are located below the rest, it suggests there is a bearish trend momentum on the market.
Another aspect to pay attention to is how tight or wide these lines are plotted. A tight position reflects weak volatility and thus should be rather avoided. Wide arrangement corresponds to high volatility and powerful market movements.
Trading strategy with the Fan RSI
Since it’s an RSI oscillator, its readings constantly move within boundaries – to be precise from 0 to 100 level. These are extremes that cannot be passed.
There are also two important levels that a trader should have a keen eye on. Namely, the 30 level and the 70 level. When the indicator’s values are below that 30 level, it means the price is considered to be oversold and one should expect an upcoming upward reversal. On the other hand, values above the 70 level suggest an overbought market state and potential downward movement underway.
What is the exact strategy for trading with the Fan RSI?
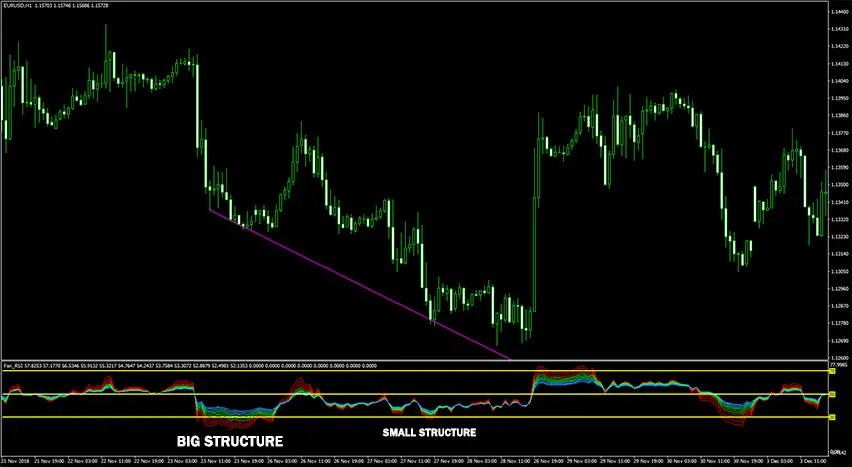
Trading with the Fan RSI is based on structures that reach overbought and oversold areas.
When the price makes a new high but the structure of RSI lines reaches an overbought area and at the same time becomes smaller as compared to the previous overbought structure then it’s an indication that the uptrend is losing its strength. In such a scenario, traders should look for a short trade opportunity.
Traders should look for long trades in the opposite situation. When the market makes a new low but the structure of RSI lines reaches an oversold area and at the same time becomes smaller in size than the previous one, it’s a suggestion that the downtrend is getting exhausted.
Buy Signal
- Price makes lower lows and higher lows points.
- Fan RSI makes a big structure in the oversold area.
- Structure of the RSI becomes smaller on the second price low.
- Take a buy trade on the reversal of the fast red oscillator above the 30 level.
Sell Signal
- Price makes higher highs and lower highs points.
- Fan RSI makes a big structure in the overbought area.
- Structure of the RSI becomes smaller on the second price low.
- Take a sell trade on the reversal of the fast red oscillator below the 70 level.

Conclusion
We find this forex indicator an interesting variation of the traditional RSI but it requires further analysis thus it may not be suitable for amateurs. In fact, it can be utilized in many ways – from simple overbought/oversold signals to complex divergencies. What’s more, it can be used as a standalone tool or as an addition to other strategies. Feel free to try it yourself.
Submit your review | |