HMA Histogram MTF Indicator
Platform: MT4 Type: Momentum Last update: October 22, 2024The HMA Histogram MTF Indicator for MT4 is based on Hull Moving Average and comes in handy when a trader is looking for force level of the market momentum.
That gauge also signals possible trend reversals and provides potential entry points and exit points of your trades. You shouldn’t have any problems understanding provided signals, as they are really simple. It’s suitable for both beginners and advanced traders.
How to trade with the HMA Histogram?
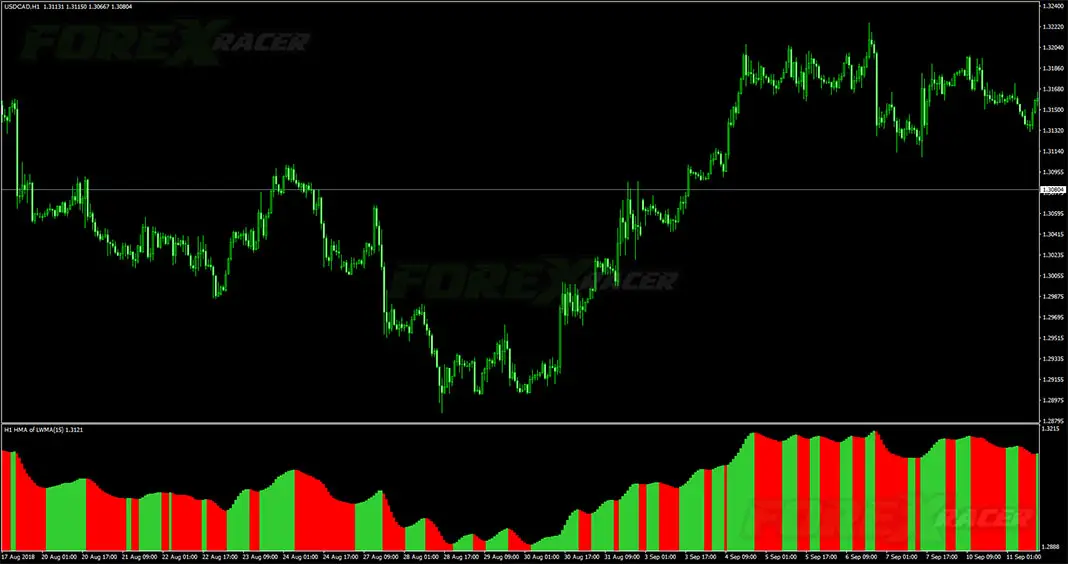
The HMA Histogram MTF Indicator uses a 35-day Hull Moving Average calculated on the Linear Weighted method. You can also apply other methods for the calculations, choosing among the following: Exponential, Weighted, Smoothed, and Simple Moving Averages.
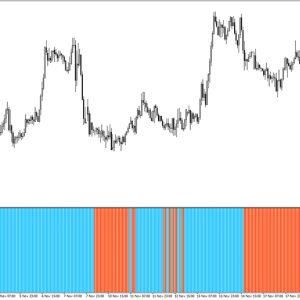
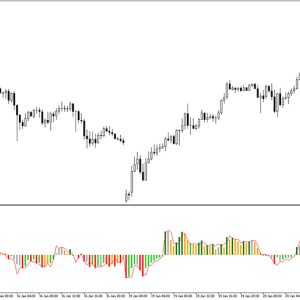
We think that a 50 Exponential Moving Average (EMA) tends to work better for intraday trading. When the histogram bars turn green, it means it recognize a bullish trend of the market. Similarly, when the bars turn red the trend is considered bearish. An increment of the indicator value reflects an increase in the strength of a trend.

Buy Signal
Follow these steps for a long trade:
- The histogram bars turn green color
- Price swings higher from recent low swing
- Buy trade is triggered after the above conditions are met
- Set stop loss a few pips below the last low point of the market
- Take profit or exit trade whenever the bars turn red or use your own preffered method of trade exit
Sell Signal
Follow these steps for a short trade:
- The histogram bars turn red color
- Price swings lower from recent high swing
- Sell trade is triggered after the above conditions are met
- Set stop loss a few pips above the last high point of the market
- Take profit or exit trade whenever the bars bars turn green or use your own preffered method of trade exit
Submit your review | |