Knoxville Divergence Indicator
Platform: MT4 Type: Pattern Last update: November 23, 2024The Knoxville Divergence Indicator for MT4 scans charts in order to recognize and plot reversal signals. While these signals occur relatively rarely, they can be very powerful when they appear.
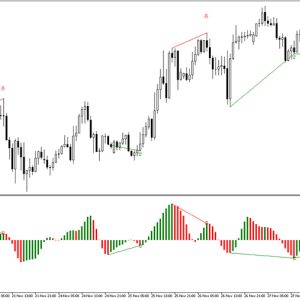
In terms of visual display, this just a short trendline connecting two points being tops or bottoms of price for some period.
Example chart:

Explaining the signals of knoxville divergence indicator for mt4
Behind the scenes, it involves two well-known gauges: relative strength index and momentum oscillator. The calculations are based on divergences between price and these two indicators. Actually, one can think about it as bi-divergence tool.
Let’s bring an bullish scenario to illustrate the approach better. The price is moving to the downside, but indicators suggest a different trend. This means the current trend is weakening and there is potential reversal underway. Forex traders can take advantage of such opportunities and open a long position.
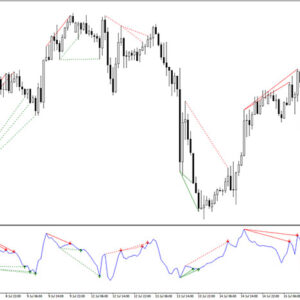
When it comes to the performance, the success rate is not very great – however when the signal is spot-on, it usually gives big profit as large risk-to-reward ratio.
This chart shows another huge winner for bearish trade:

Submit your review | |