MACD Coloured Histogram Indicator MT5
Platform: MT5 Type: Momentum Last update: February 21, 2026The MACD Coloured Histogram Indicator for MT5 is responsible for calculating the difference between the MACD and its signal line and displays the result as a colorful histogram.
This makes understanding provided signals even easier.
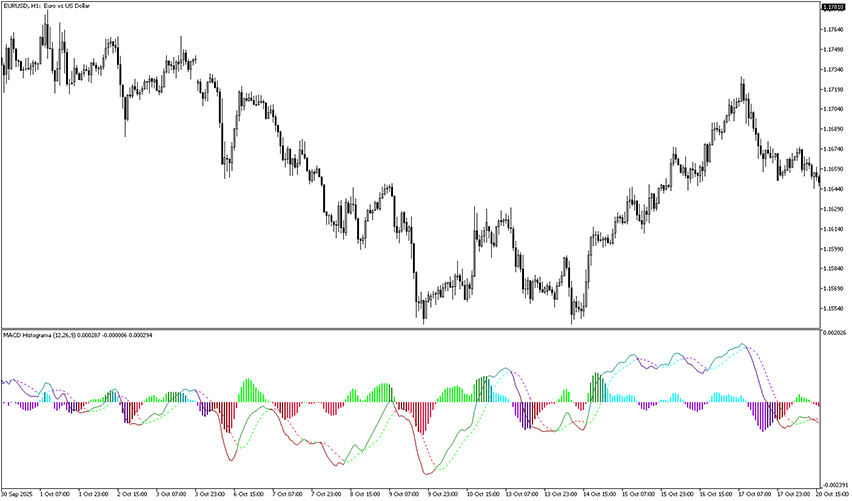
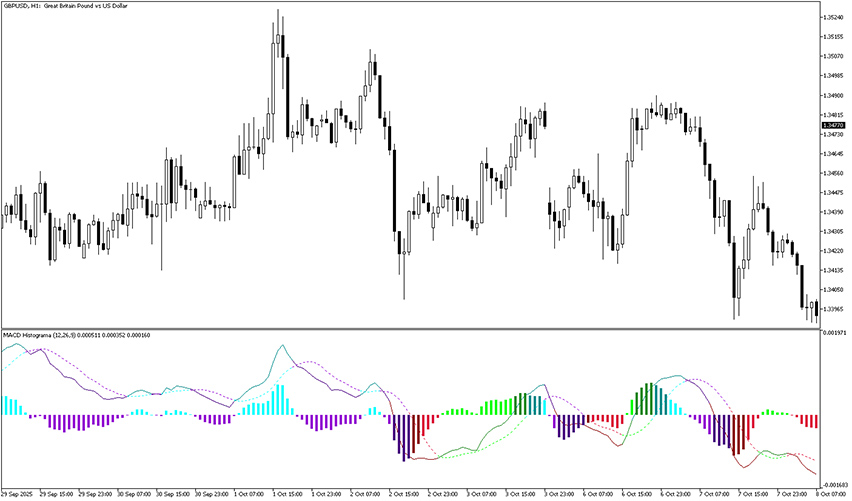
Example chart:
How to use the MACD Coloured Histogram Indicator for MT5?
Once the indicator is activated in MetaTrader 5, it displays histo bars with various colours. They are used to represent crossovers, positive or negative trends and changes in momentum.
- Green and red – when the MACD lines are in the negative area
- Blue and violet – when the MACD lines are in the positive area
The best use case for this MACD indicator is identifying entry and exit points in trend strategies or in reversal strategies (analyze divergences between price and momentum).