MACD Histogram with Filter MA Indicator
Platform: MT4 Type: Momentum Last update: December 7, 2024The MACD Histogram with Filter MA Indicator for MT4 is, as the name suggests, a combination of the popular momentum indicator MACD Histogram with the trend determinator Moving Average. As a result, one gets a gauge that provides the correct areas to make the market entry and trade exit too.
Anatomy of the MACD Histogram with Filter MA Indicator
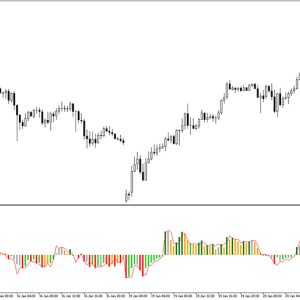
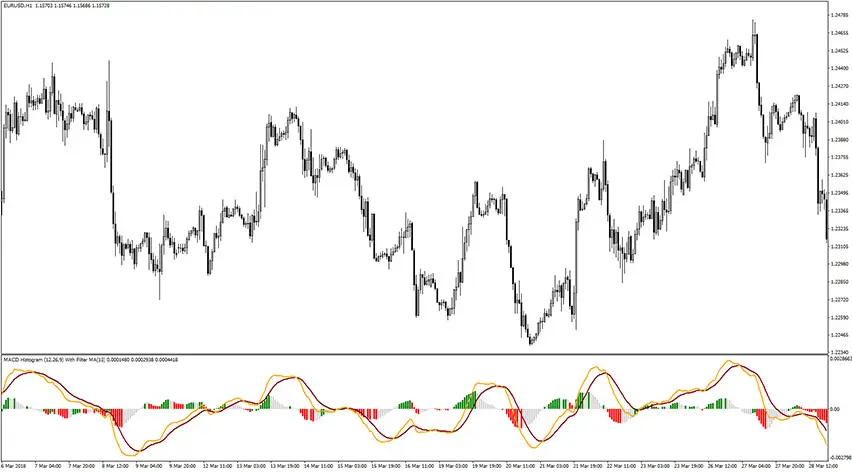
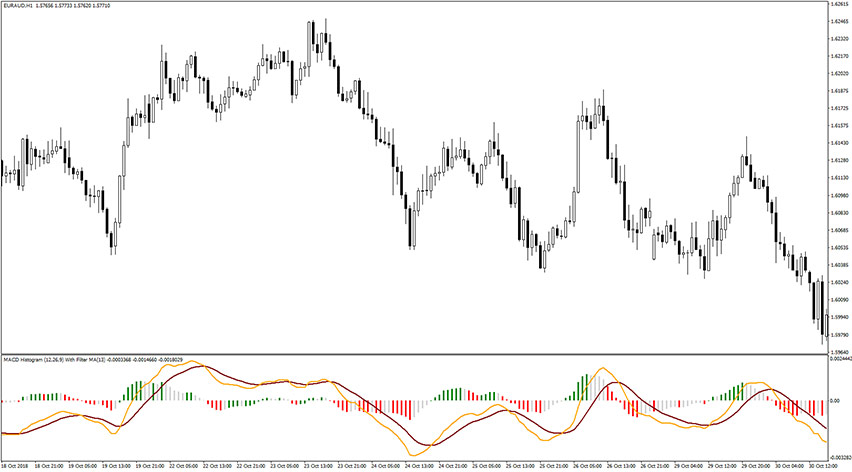
The MACD Histogram with Filter MA Indicator allows catching the ongoing trend-momentum along with entry and exit signals. When the MACD Histogram value readings are positive and the fast MA (orange) crosses above the slow MA (dark red) plotting the bullish crossover, it means the momentum is considered bullish and a trader should look for abuy entry. Conversely, when the MACD Histogram value goes negative and the Moving Averages are plotting bearish crossover, the indicator suggests looking for a sell entry, as bearish momentum is considered.
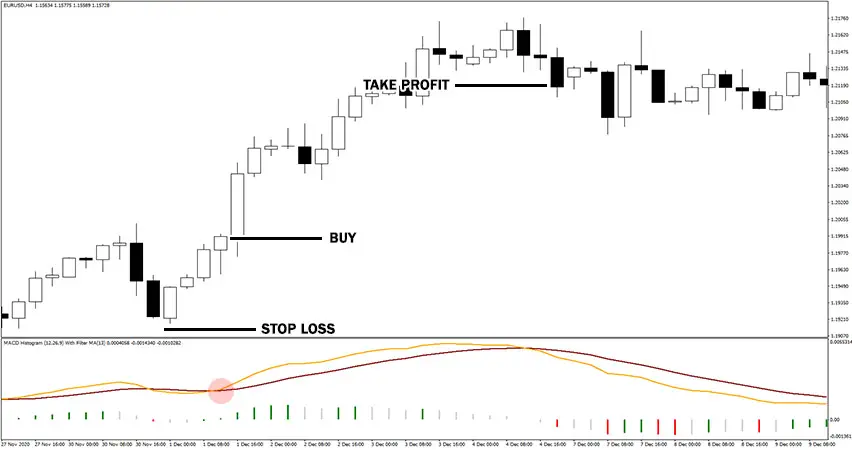
Buy Signal
Follow these steps for a long trade:
- MACD values should be positive – above 0 level
- The orange MA crosses over dark red MA to the upside
- Bullish price pattern is formed
- Buy trade is now triggered
- Set stop loss a few pips below the most recent market low
- Take profit when the opposite crossover happens or use your own trade exit strategy
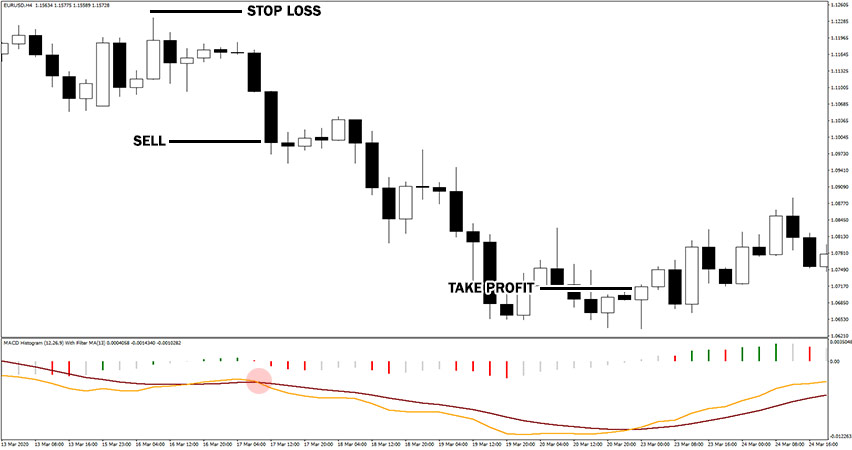
Sell Signal
Follow these steps for a short trade:
- MACD values should be negative – below 0 level
- The orange MA crosses under dark red MA to the downside
- Bearish price pattern is formed
- Sell trade is now triggered
- Set stop loss a few pips above the most recent market high
- Take profit when the opposite crossover happens or use your own trade exit strategy
Submit your review | |