MTF High Low Indicator
Platform: MT4 Type: Market Levels Last update: September 23, 2024The MTF High Low Indicator is responsible for drawing high and low levels of previous and current daily, weekly, and monthly periods. These levels are often respected as market turning points, thus traders can take advantage of trading at them.
Closer look on the MTF High Low Indicator
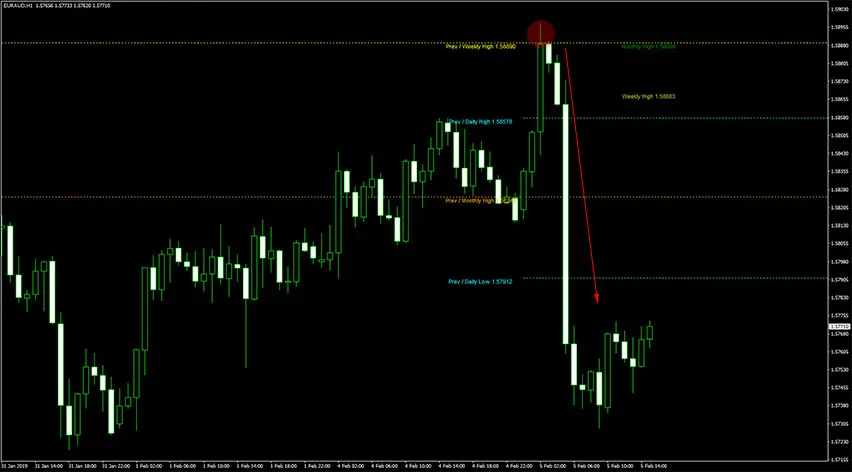
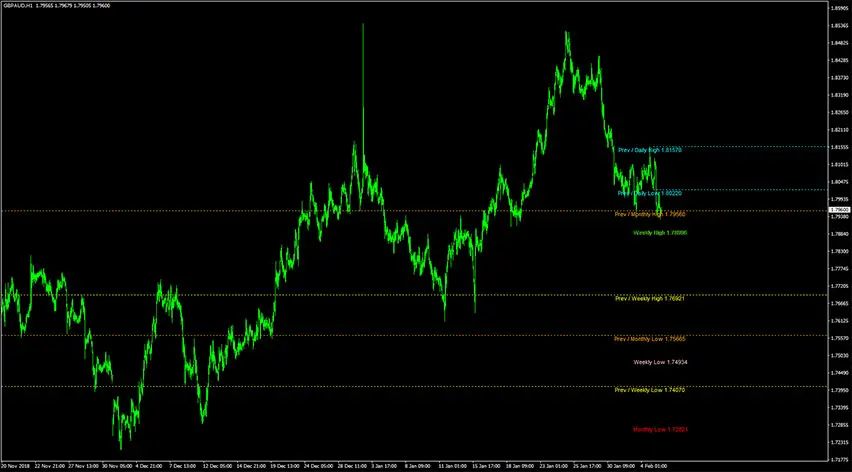
When you load up the indicator in your MT4 platform, you will see a couple of horizontal lines that reflect important market levels including monthly hig and low, weekly high and low, previous monthly high and low, previous weekly high and low, previous daily high and low. Each level has its own label, so one quickly can recognize it. Take a look at example chart:
Buy Trade Example
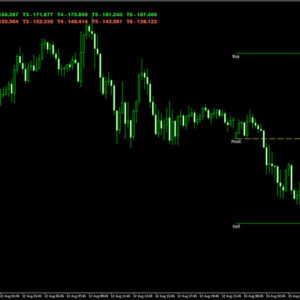
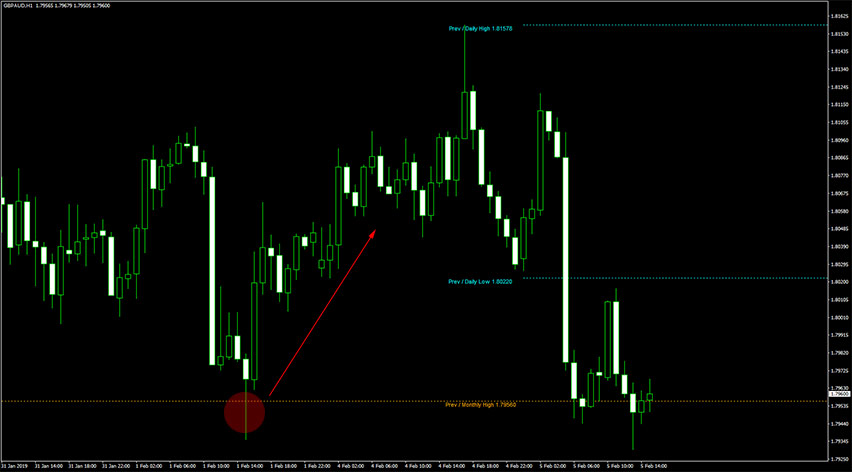
In the example below, one can see how the price reacts to the previous monthly high level. There is a Doji candle that touched the level only once and then upward impuls occurred. In that case, the resistance level became the support level.
Sell Trade Example
In the example below, one can see how the price reacts to the previous weekly high level. That level acts as the resistance level and the price rejected it forming three soldiers bearish pattern.