Fibonacci Pivots Indicator
Platform: MT4 Type: Market Levels Last update: December 5, 2024The Fibonacci Pivots Indicator for MT4 is responsible for calculating and plotting these crucial levels directly on the activity chart. You can think about them in terms of support and resistance – they are famous for being well respected by the price. These areas are perfect places for potential entry and exit points.
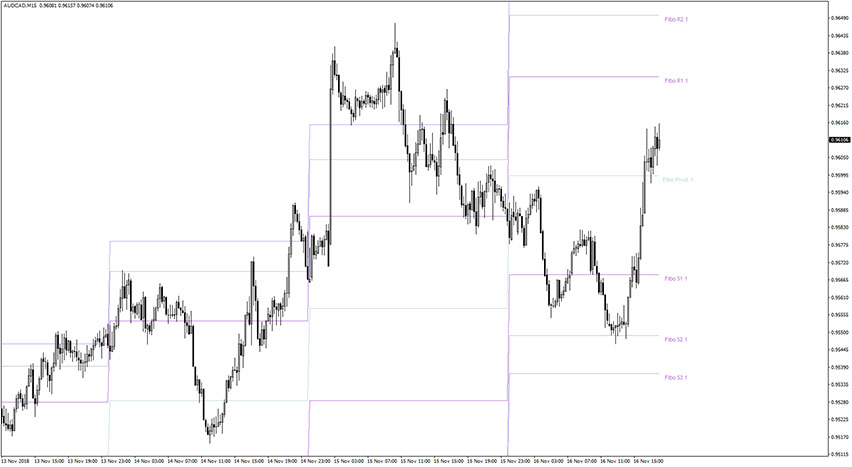
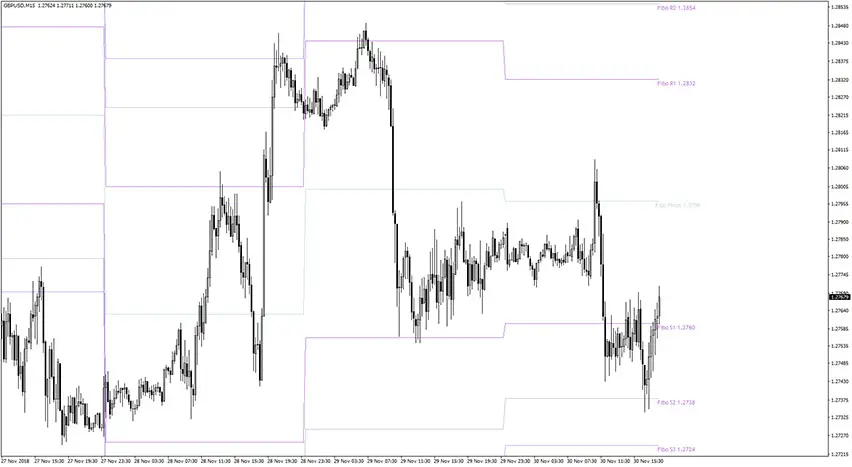
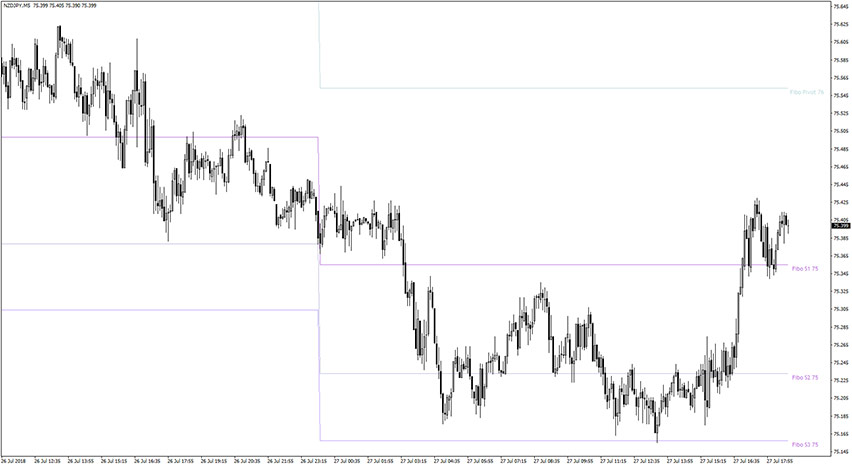
Example chart
How to use the fibonacci pivots indicator in metatrader 4?
After the activation, you will see the light blue pivot line standing in the middle and three extensions per each side – upper and lower – and obviously based on typical ratios of 38.2, 61.8, and 76.4. Also, all these values are based on the previous day data including high and low.
As a rule of thumb, when candlestick are located below the pivot, the trend is considered bearish. Conversely, when they are aligned above it, it means a bullish trend. Please note that it is possible for the price achieve both setups within same day.
There are two types of approaches for trading and entries:
- when crossing the fibo level
- when reacting at extensions (support and resistance levels)
The first one applies on bias change, however it’s a bit tricky as price not always change direction with full power. Sometimes it does so, but there is some risk involved.
The second approach tells to watch the price action at S1,S2 S3 for long opportunities and R1, R2, R3 for short potential transaction. If there is a rejection pattern forming it’s a trigger to open a trade. The fewer touches the better. When applied correctly, it is a very powerful and profitable method with limited risk. The stop loss should be only placed in a few pips distance from the given extension, while take profit is a multiple of this value.
Generally speaking, the fibonacci pivots gauge has very versatile application and can be successfully onboarded to many forex strategies and used together with various indicators.
Submit your review | |