Fractal Support and Resistance Indicator MT5
Platform: MT5 Type: Market Levels Last update: March 26, 2025The Fractal Support and Resistance Indicator for MT5 is responsible for drawing multiple horizontal lines. These levels are calculated based on fractals, which means using local high and low points in given period.
The support and resistance lines define the boundaries within which the price moves most of the time, however sooner or later a breakout occurs. Probability-wise speaking, they serve as a solid and accurate price turning points and can be used by forex traders for profitable trades.
Example chart:

How to use the fractal support and resistance mt5 indicator?
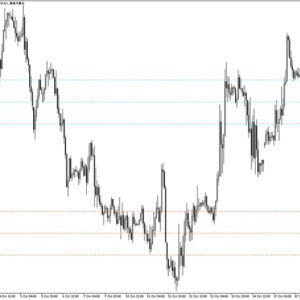
After the activation of this indicator, you will notice that multiple horizontal lines appear across the chart. What’s more, they are presented in a variety of colors and styles, which helps to quickly identify the timeframes they represent – details outlined below:
- weekly – solid red lines
- daily – solid orange lines
- 4 hours – dotted orange lines
- 1 hour – dotted green lines
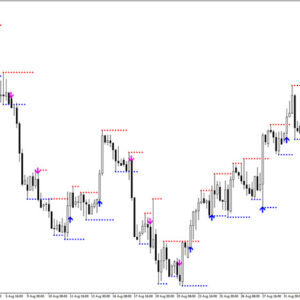
When it comes to trading, it’s critical to observe price action in order to confirm entries – it should form an reversal pattern. Such candles often have long wicks. Take a look at the chart below.

You can clearly see how price rejected support at the bottom and multiple times rejected resistance at the top. All these potential trades would resulted in great profit with excellent risk to reward ratios.
Fractals-based formula explained
The regular fractal indicator identifies potential reversal points by marking them with triangles on the chart. These points, when connected, form these horizontal boundaries and this tool automates the whole process.
Submit your review | |