ATR Support/Resistance Levels Indicator
Platform: MT5 Type: Market Levels Last update: December 14, 2024The ATR Support/Resistance Levels Indicator for MT5 uses, as the name suggests, the Average True Range to define three precise support and resistance levels on trading charts. The goal of this tool is identification of key areas at which there is high-probability of strong market reactions.
Levels of higher importance explained
The formula behind this indicator involves calculations based on ATR readings as it’s proven method of measuring daily volatility levels. Knowing the extremes, it can provide regions that can be easily utilized, actually in various ways.
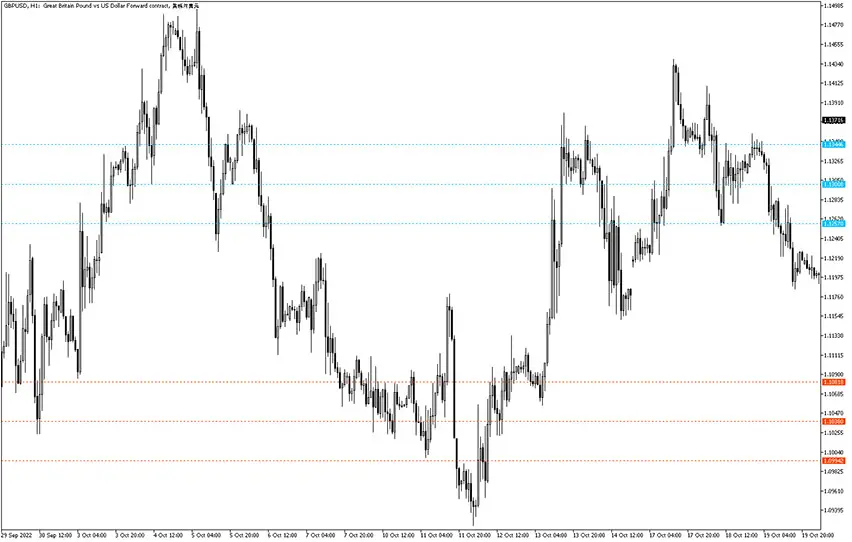
But before we dive, this is how your chart should look after activation.
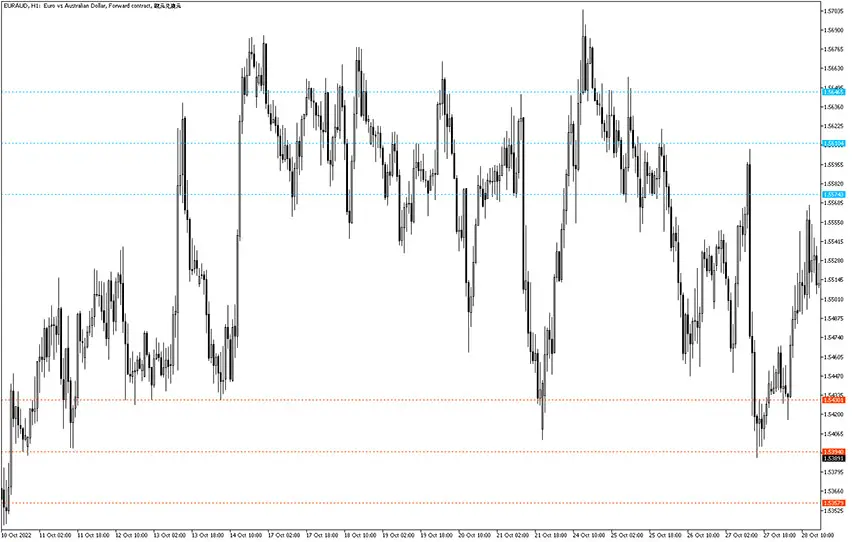
As you can see, there are three extensions in the upper part and also three in the bottom part.
It’s a basic knowledge that market’s price moves in waves, making extremes and then usually pullback. It’s a constant ups and downs game. We can leverage that fact to increase likelihood of opening profitable trades. This technique gives the best results during sideways market (and that happens about 70-85% of the time!).
So the main benefits of this gauge are:
- Pointing trade entry points
- Suggesting stop loss levels
- Determining optimal take profit targets
Simplified approach
You should observe and watch price coming close the horizontal lines – these are areas where potential reversal may occur. The signals must be valided with price action patterns. What’s more, it’s a good idea to combine it with other technical indicators for double confirmations.
In general, long trade opportunities happens at the lower support lines. Conversely, short trade opportunities may be spotted at the higher resistance lines.
Submit your review | |