ADR Indicator MT4
Platform: MT4 Type: Market Levels Last update: May 16, 2026The ADR Indicator for MT4 displays daily support and resistance levels based on expected range. It helps traders to forecast the take profit and stop-loss targets with high accuracy.
The ADR abbreviation stands for average daily range.
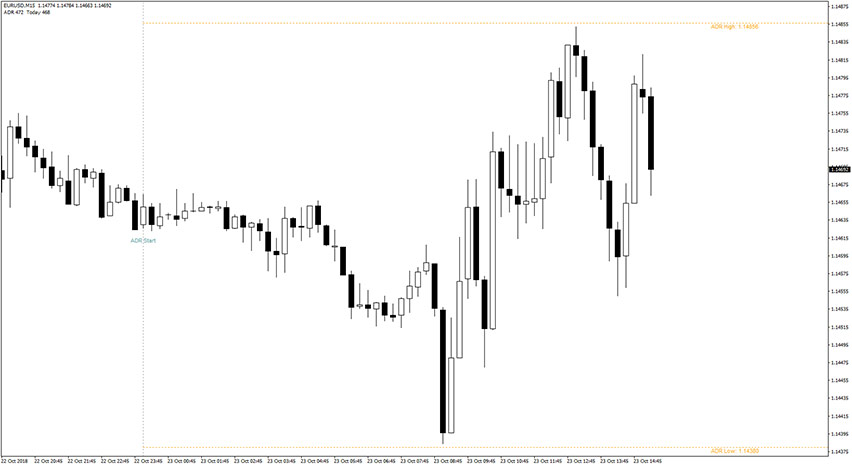
Example chart:
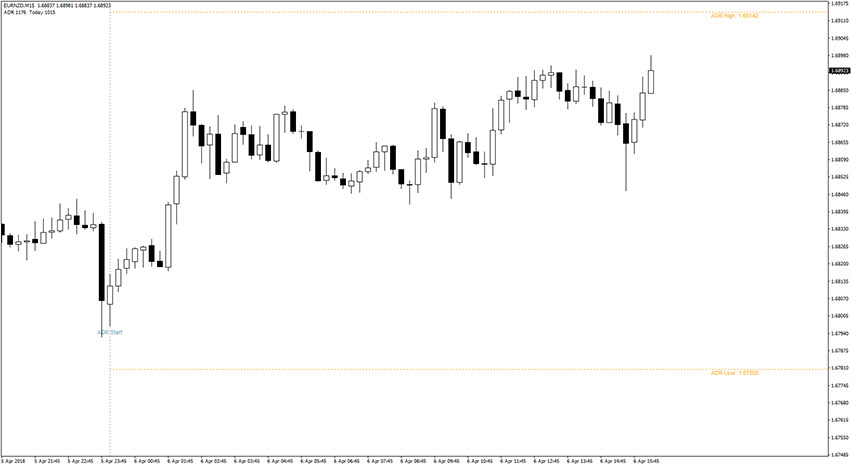
How to use the ADR Indicator for MT4?
Traders should keep an eye on price action on the levels defined by the ADR indicator.
Changes in volume and momentum near the upper or lower line may indicate a trend continuation or a price reversal.
So, there are 2 key ways to use it:
- breakout trading – when price pushes behind a S/R line (this is a high volatility scenario!)
- reversal trading – when candlesticks pattern suggests reversal forming
It’s crucial to observe and understand price action near these sensitive zones.
As a rule of thumb: price at the low line reflects oversold condition, and conversely, price at the high level suggests overbought bias.
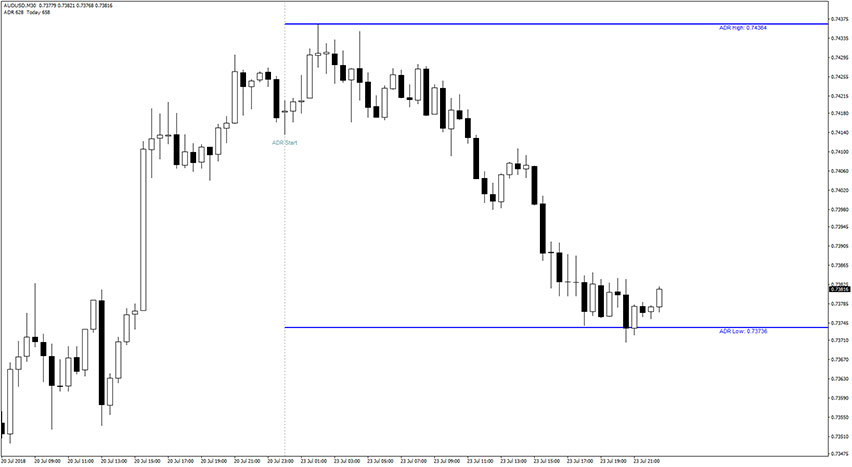
Take a look at the above AUD/USD M30 chart.
It shows a bullish setup being formed at the lower ADR line. This is a good moment to enter a long position.
One could put a stop loss a few pips below the last swing low and profit target being at least 1:2 risk-to-reward ratio.
How are ADR values calculated?
By default, the ADR indicator calculates the average daily range based on the previous five days data.
This input can be adjusted per your preferences, e.g. set ATRPeriod to 10 or 15.
These are all the variables you can customize in the settings window: