Murrey Math Lines Indicator
Platform: MT4 Type: Market Levels Last update: September 26, 2024The Murrey Math Lines Indicator for MT4 is a technical analysis tool that identifies horizontal support and resistance levels of price on trading charts and it’s available to free download. It functions similarly to pivot point indicators and Fibonacci retracements.
This indicator was created by T. Henning Murrey with the goal of providing day traders with a MetaTrader tool that predicts robust S/R levels on the chart.

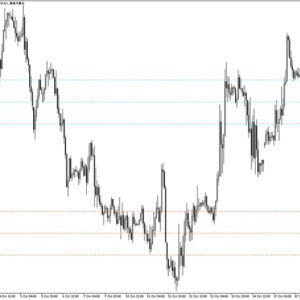
Introducing the murrey math lines
As you can see, it comprises nine equally spaced levels that are plotted in parallel to identify potential price reversal zones. In addition to long-term support and resistance levels, this indicator also calculates daily mid-levels that are important for determining short-term entry and exit points.
Characteristics of these lines
According to Gann’s theory, prices move in 1/8 increments, and these 1/8 levels serve as points of price support and resistance as an entity’s price changes over time. Murrey Math Lines (MML) Indicator assigns specific properties to each MML in a given octave based on this 1/8 characteristic of price action.
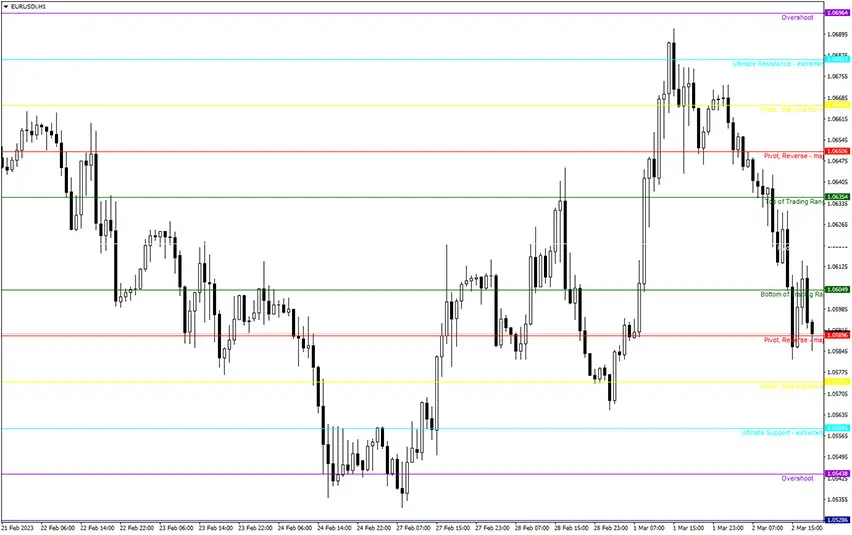
Below are the properties assigned to each MML:
8/8ths and 0/8ths Lines (Ultimate Resistance): These lines are the strongest levels of price resistance, making it difficult for prices to move beyond them on the way up, but they offer the greatest support on the way down. Prices may never surpass these lines.
7/8ths Line (Weak, Stall and Reverse): This line is relatively weak, and if prices rise too fast and stall at this level, they will reverse down quickly. If prices do not stall at this level, they are likely to move up to the 8/8ths line.
6/8ths and 2/8ths Lines (Pivot, Reverse): These two lines are the next strongest levels of price support and resistance after the 4/8ths line. They have the ability to force prices to reverse, whether prices are moving up or down.
5/8ths Line (Top of Trading Range): Entities’ prices typically spend 40% of their time moving between the 5/8ths and 3/8ths lines. If prices move above the 5/8ths line and remain above it for 10 to 12 days, the entity is said to be selling at a premium and prices will tend to stay above this line in the “premium area.” However, if prices fall below the 5/8ths line, they are likely to fall further and find support at a lower level.
4/8ths Line (Major Support/Resistance): This is the strongest level of support and resistance. When prices are above it, it provides the greatest support, and when prices are below it, it offers the greatest resistance. This line is considered to be the best level to sell and buy against.
3/8ths Line (Bottom of Trading Range): This is a level that is difficult to penetrate if prices are moving upwards from below it. If prices move above this line and stay there for 10 to 12 days, they will remain above this line and spend 40% of the time moving between this line and the 5/8th Line.
1/8ths Line (Weak, Stall and Reverse): It is considered the weakest level. If prices drop too quickly and stall at this line, they will reverse upwards quickly. If prices do not stall at this line, they will continue to move downwards towards the 0/8th Line.
Conclusion
The Murrey Math Lines indicator automatically scans and plots precise support and resistance levels, enabling forex traders to identify optimal opportunities for buy and sell trades. This gauge is suitable for both novice and experienced forex traders. Novice traders can quickly identify the current market trend and locate stop-loss and take-profit points with ease. Meanwhile, experienced traders can formulate more advanced trading plans.