PAIN Indicator MT5
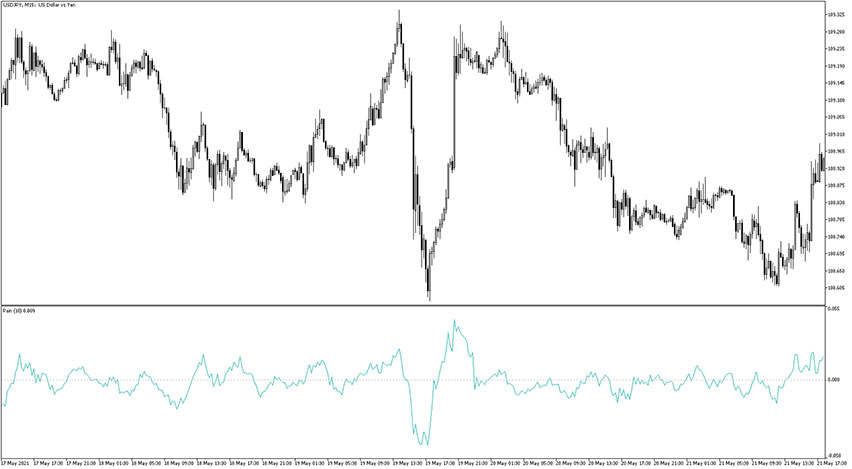
Platform: MT5 Type: Oscillator Last update: November 9, 2025The PAIN Indicator for MT5 is an oscillator responsible for showing the OHLC candlestick price ratio over a specified time period. The name of this tool basically means “PriceActionINdicator”.
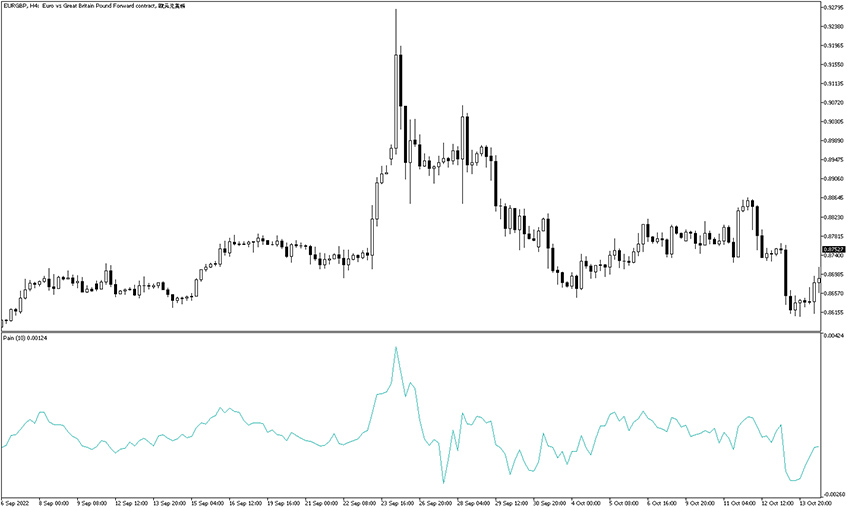
Example chart:
How to use the PAIN Indicator for MetaTrader 5?
The pain indicator allows determining a market sentiment, whenever it’s bullish or bearish. When the light green signal line is aligned above 0 level, the sentiment is considered bullish. Similarly, when the light green signal line is aligned below 0 level, the sentiment is considered bearish.
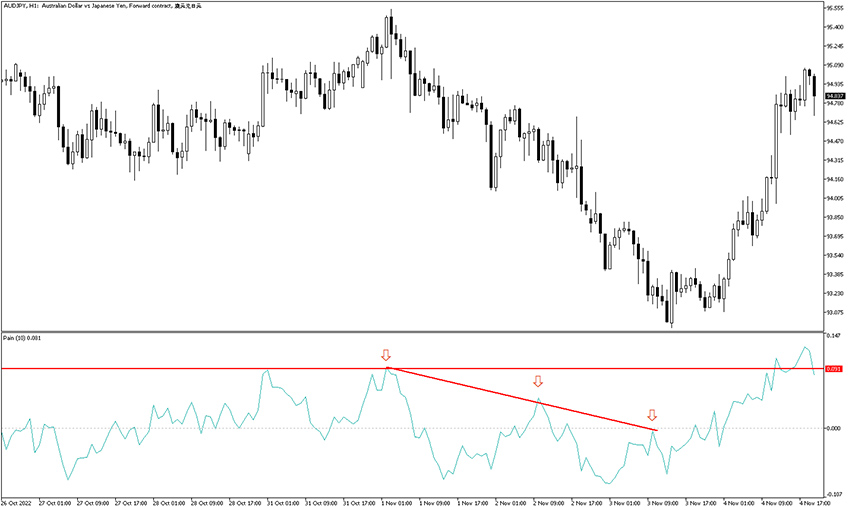
It also works great with support and resistance levels or trendlines. Take a look at this AUD/JPY H1 chart that shows these in action. Potential trades are marked with arrows.
Another way of using the pain indicator is divergence trading.
In order to do that, a trader needs to wait for the price to make higher highs while indicator develops a corresponding lower lows (for bearish divergence). On the other side, a trader can wait for the price to make lower highs, while the indicator main signal line develops a corresponding higher highs (for bullish divergence).
Formula behind the pain indicator
The calculations of the pain indicator are based on the following formula:
PAIN = (3*MA(Close) – MA(Open) – MA(High) – MA(Low)) / 2
Where:
MA – moving average with the Period time period and the Method calculation method.
Settings
In the settings tab there are only two customizable inputs, which are the following:
- Period – defines the period deployed in the calculation (default: 10).
- Method – defines the method used for the calculation (default: Simple).