Pattern Recognition Indicator
Platform: MT5 Type: Pattern Last update: December 8, 2024The Pattern Recognition Indicator for MT5 is forex tool designed to detect and display candlestick patterns on your charts as soon as they emerge. This indicator is specifically developed to automatically identify and highlight candlestick patterns in real-time on your trading charts.
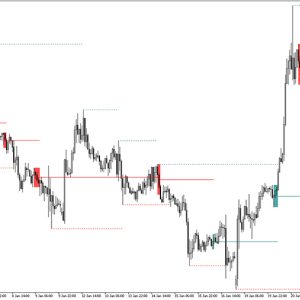
When it’s activated, your chart should look more less like this.
How does it work and what kind of patterns it provides?
The indicator is capable of recognizing several candlestick patterns, including:
- shooting star
- bullish & bearish hammer
- evening & morning star
- evening & morning doji star
- dark cloud pattern
- piercing line pattern
- bullish & bearish engulfing pattern
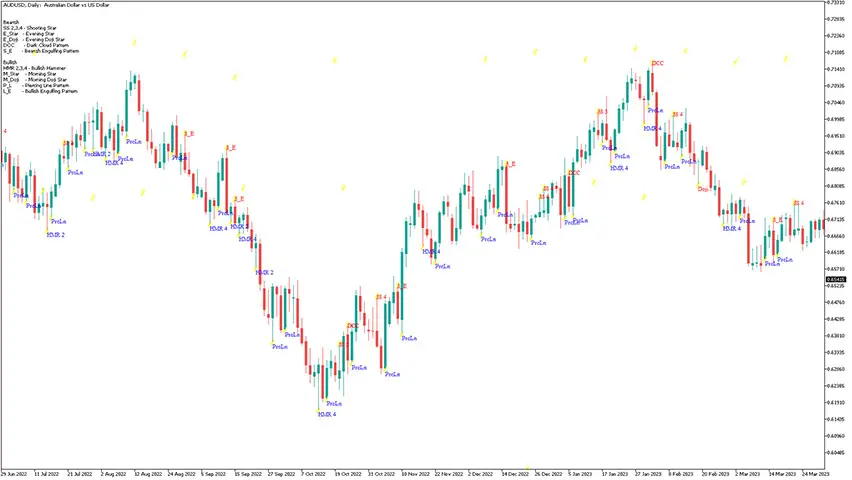
Once a pattern is in place, the corresponding candle is tagged with a short name placed below or above that candle. For example, HMR means Hammer or SS is for Shooting Star. On the top left, there is a list explaining all patterns and their short names.
How to get the most of it?
The most profitable and crucial approach is to have good understanding of market structures. Knowledgeable trader who is familiar with popular patterns and how they imply in trading, will surely get the most of it, as he will know underlying moves in the making.
Once can also improve success probability by introducing additional technical analysis indicators instead using solely this pattern recognizer alone.
Practical usage – trade examples and analysis
Let’s have some analysis, so you can learn from it and draw practical conclusions.
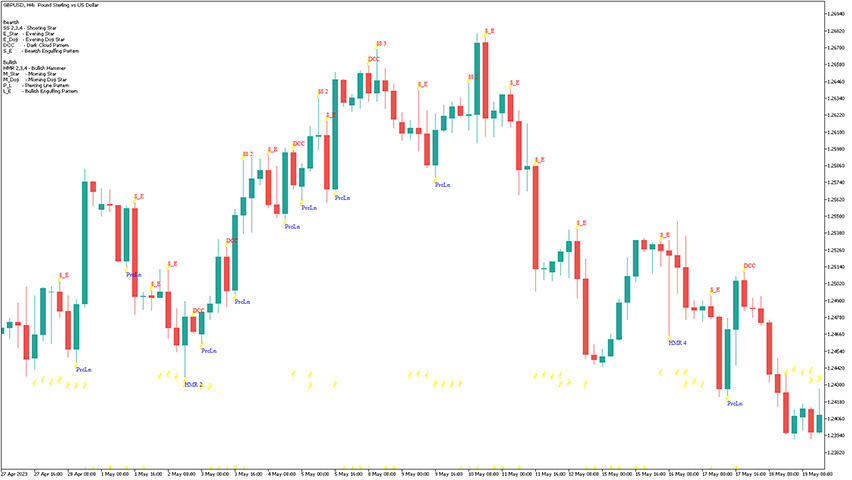
Generally good idea is to trade in the direction of the major market trend. It means not to utilize the bearish patterns during strong uptrend or bullish ones in the downtrend scenario.
Let’s apply a 50-period EMA (blue line) for trend definition, just like in the example below.
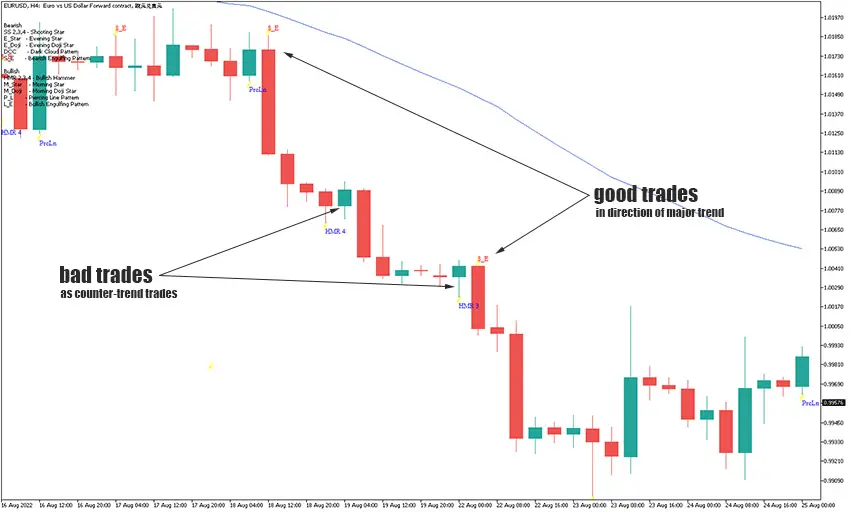
Good trade – what makes it a profitable one
As you can see in the attached chart, there is clearly a bearish trend. Taking into the consideration the probability odds, it’s much better to target sell trades.
One of the strongest bearish patterns is “engulfing pattern”. You can notice two occurences of bearish englufing candles with large bodies. After they were closed, it was a signal for short trades. The outcome of both would be a decent profit – due to the combination of probability factors: dominant trend and effective pattern.
Bad trade – why and how to avoid
Well, you can notice few bullish patterns like “hammer”, but none of them would turn into a profitable. It’s just another confirmation that counter-trend trades are risky. As a general advice, it’s better to follow the trend, unless you really know what are you doing.
Summary
The candlestick patterns can be applied to various strategies without limitations of some specifc approach. To increase the success rate even further, it’s a good idea to use it in conjuction with other technical indicators.
Submit your review | |