Hikkake Pattern Indicator MT5
Platform: MT5 Type: Pattern Last update: January 1, 2026The Hikkake Pattern Indicator for MT5, alternatively known as the Inside Day False Breakout, is a trading strategy centered around deceptive breakouts. Free download is available.
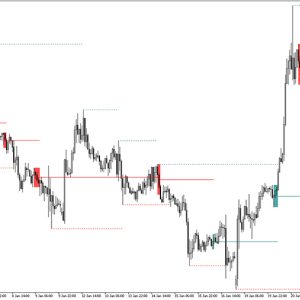
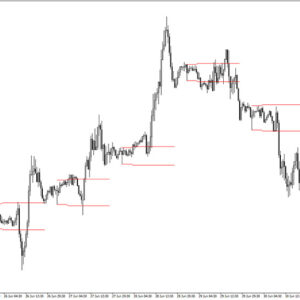
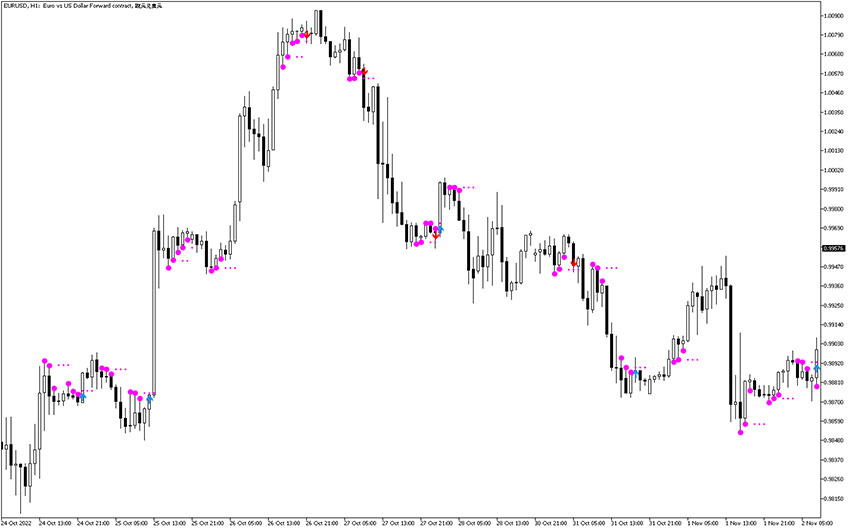
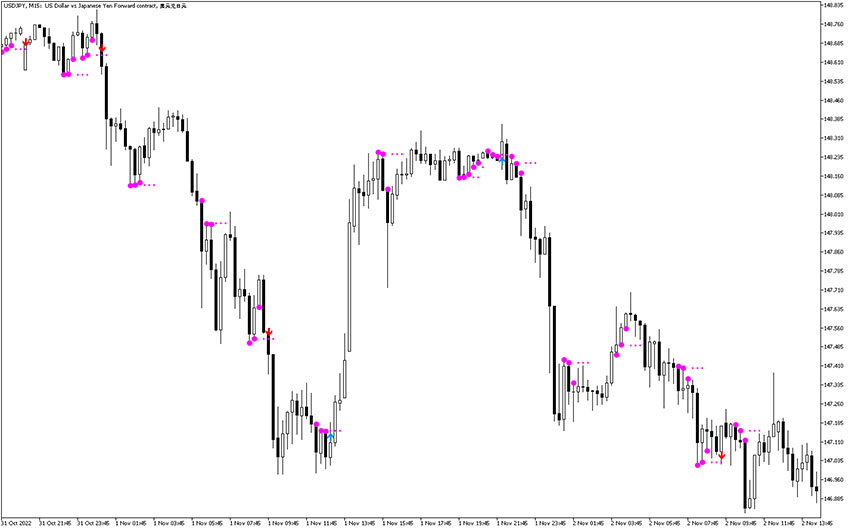
Example chart:
The MQL5 code of the indicator originated from an article written by Dan Chesler and published in April 2004 in Active Trader Magazine, titled “Trading False Moves with the Hikkake Pattern.”
The Hikkake pattern is a simple formation consisting of two price bars, such as two hourly bars, two daily bars, two weekly bars, or two monthly bars. In this pattern, the first bar is typically an inside bar, characterized by a lower high and a higher low compared to the previous bar.
The second bar in the standard Hikkake pattern must exhibit a higher high and higher low than the preceding inside bar to qualify as a bearish Hikkake price pattern. Conversely, for a bullish Hikkake price pattern, the second bar must have a lower low and a lower high than the preceding inside bar.

How to use the Hikkake Pattern Indicator for Metatrader 5?
The essence of the Hikkake setup lies within two bars. Let’s say the market has recently broken out from an inside bar, indicating that traders are inclined to follow the market’s direction aligned with the breakout.
However, the true intention of the market becomes apparent when it starts moving in the opposite direction of the initial breakout. As with any other pattern in the market, confirmation is crucial before executing a trade.
When employing the Hikkake pattern, it is important to note that a false pattern should not be anticipated unless the price surpasses the high of the inside bar (for a bullish pattern) or falls below the low of the inside bar (for a bearish pattern). Confirmation should ideally occur within three candles following the formation of the Hikkake pattern, otherwise the pattern should be disregarded.
Conclusion
The Hikkake Pattern indicator for MetaTrader 5 was initiated based on Dan’s theory of Hikkake pattern, starting from a clean slate.
This indicator exhibits three prominent dots as a visual representation when the pattern is detected. Subsequently, on the following three candles, smaller dots are displayed to pinpoint the theoretical entry point for a trade. As the price reaches this theoretical entry point, a buy or sell arrow becomes visible, indicating the recommended action.