Breakout Box Indicator
Platform: MT4 Type: Market Levels Last update: September 21, 2024The Breakout Box Indicator for MT4 was created to detect and mark important support and resistence levels directly on trading chart. It uses special formula to analyze price and once it recognizes that potential places, the tool draw boxes around these significant market areas.
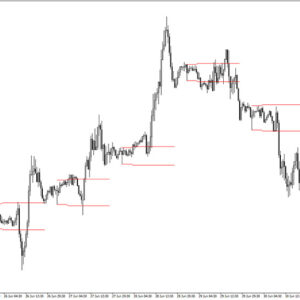
In other words, this gauge provides perfect opportunities for traders whos strategies are based on price breakouts and meaningful fluctuations. Let’s check how effective this one really is. But before that, let’s get familiar with its looks – this is an example chart.
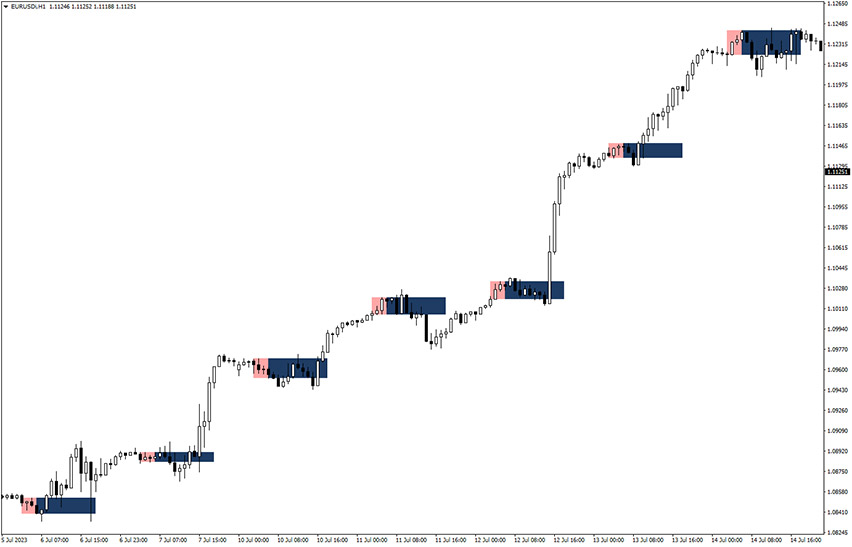
As you can see, it does an extraordinary job at spotting and drawing rectangular boxes and, at the same time, revealing strategic points at which authentic and high-probability impulses take place. Being equipped in this knowledge, one can make reliable projects of upcoming moves. Actually, there are multiple ways of using it. We will describe the two popular approaches.
NOTE: This tool is designed for performing technical analysis on timeframes shorter than 4 hours. It simply doesn’t work on higher ones, so please remember about this limitation while using it.
How to trade with this indicator?
Let’s have a look on how to trade with the breakout box. A nice thing about it is that there’s no need of onboarding any additional support indicators. In order to take advantage of profitable setups (and higher winning rate), all that is really needed is reasonably good technical analysis skills.
Breakout strategy #1
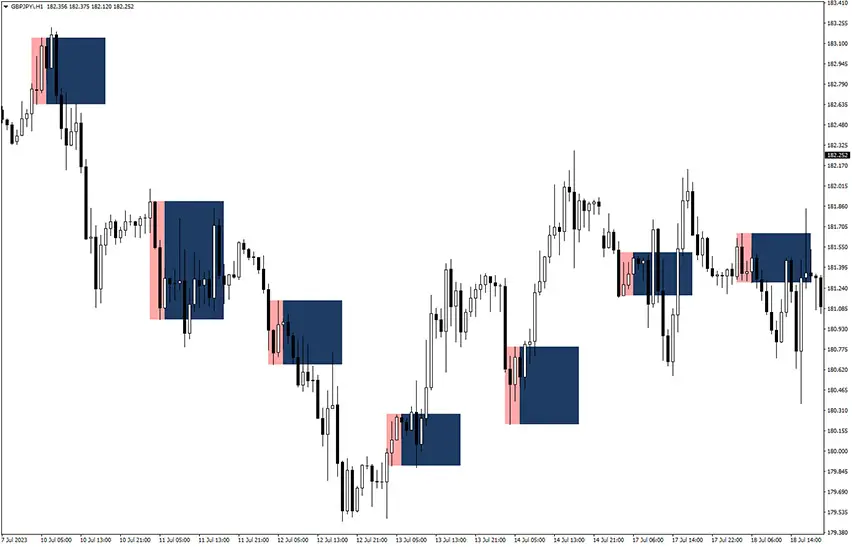
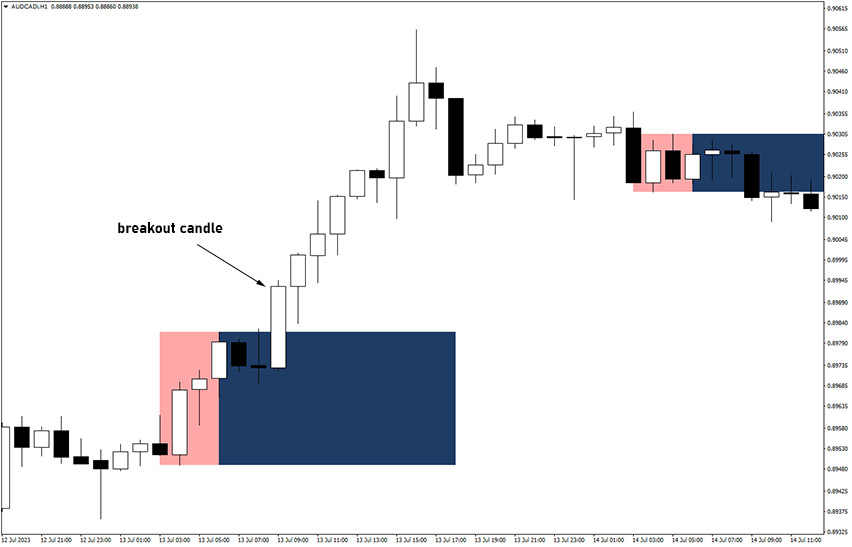
The first one involves observing the overall trend and the market bias. Once the direction is clear, wait for the price to break out of the pink-blue rectangle. The candle must close outside this area and be in alignment of the current trend. For example, in the bullish market, open a long trade only once the price breaks and closes above the indicator’s box.
Breakout strategy #2
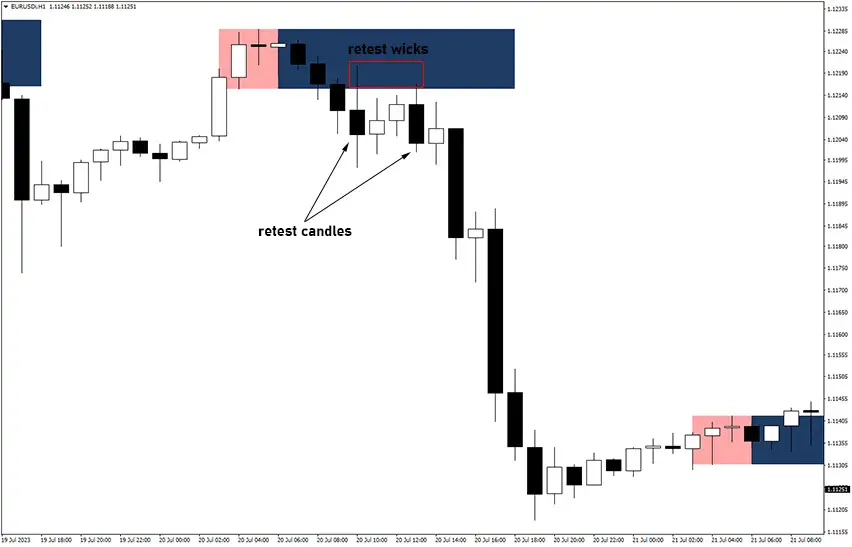
The second approach is a bit more sophisticated and in my opinon a better one. It’s not occuring all the time, but it has high probability once it appears. To secure this setup, patiently await a candlestick to break out of the box.
Next step is crucial here. Watch for a candle to retest and reject the highlighted zone. There must be clear and visible rejection, which is usually characterized by a long wick. Afterwards, jump into a trade as soon as possible – obviosuly, in the direction of the breakout.
When there is that scenario happening where such breakout is followed by rejection bar, it means the zone was realy solid. As a result, the price is very likely to keep moving away from it, maximizing potential profit.
Summary
We think this is one of these indicator that you shouldn’t miss. Of course, it requires some effort and skill on trader’s side, but the strategy applied here is robust and proven to work in the long run. Feel free to use any variations of analysis. You can even onboard additional tools if you want, but this one is a solid foundation.