Breakout Bars Trend Indicator
Platform: MT5 Type: Trend Last update: December 7, 2024The Breakout Bars Trend Indicator for MT5 simply colorizes candlesticks directly on the chart in order to provide market trend-momentum with a quick glance. This is a great way to reduce clutter in your technical analysis and improve confidence of the trading decisions.
You can consider it as an alternative to moving averages that help identyfing trend directions. In fact, the formula behind it involves the linear reversal and the iMovement indicators. What’s more, it also account breakouts, but let’s see what is this really about.
What are these breakout bars actually?
In this case, the breakout bar means the setup where the candlestick closing price exceeds the extreme high or low of the previous one.
Simply speaking it just checks the current and previous bar if the closing is higher or lower and if so, the current bar gets colorized to darker and stronger color. While it’s not super fancy technique, it still provides valuable insights.
Using colored bars in trading
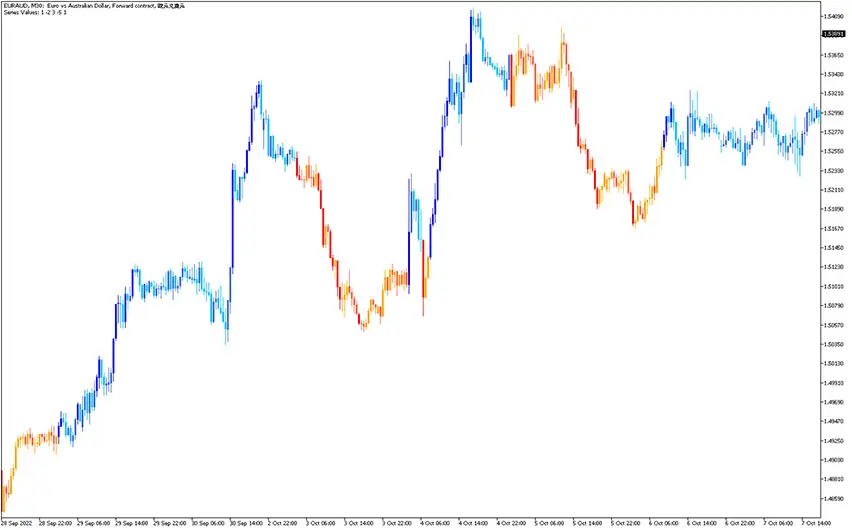
The indicator utilizes four colors: two pairs of light (for a non-breakout bar) and dark (for a breakout bar) per direction. The dark blue and light blue corresponds to bullish market, and similarly, orange and red reflect bearish market.
As you can see, they act as a nice visual reference and provide helpful hints to navigate in the trends.
Indeed, this is a very universal tool and it can be applied to various techniques and strategies. Let it be any support and resistance trading approach like trendline, price channel or in a combo with literally any gauge. Let us show you some examples.
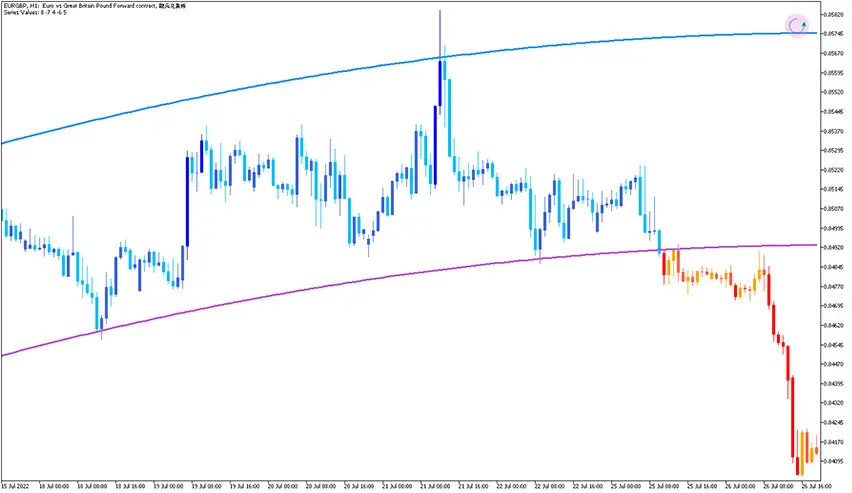
Channel breakout
This chart shows a classic scenario where price moves within bands of a channel (in particular, the one defined here is plotted by Fibonacci Arcs). The recommnded approach here is to wait for a breakout and that’s exactly what happend. It occured almost perfectly when breakout bars turned redish.
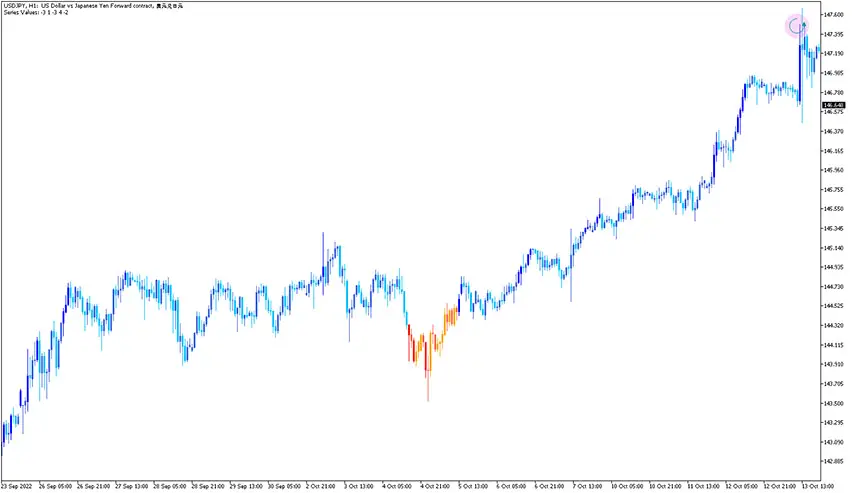
Pullback during strong trend
In this chart we can strong dominating trend. The recommended approach in this scenario is wait for a pullback and enter a trade when a trend resumes. As you can see, in the ocean of blue, a small pullback occured. One should jump in at the first dark blue bar. Later on, the price moved up significantly.
Conclusion
We think this is a very solid indicator that allows safer trading. It lowers the concetration time needed for setup analysis, you just need to wait for a match and proper candle color. What’s more, it can be sucessfully applied to various forex strategies.
Submit your review | |


