Trend Direction V2 Indicator MT4
Platform: MT4 Type: Trend Last update: September 13, 2026The Trend Direction V2 Indicator for MT4 analyzes past and current price data to identify the dominant market trend, displaying the result as a clean, easy-to-read histogram.
Example chart:
How to use use Trend Direction V2 Indicator for MT4?
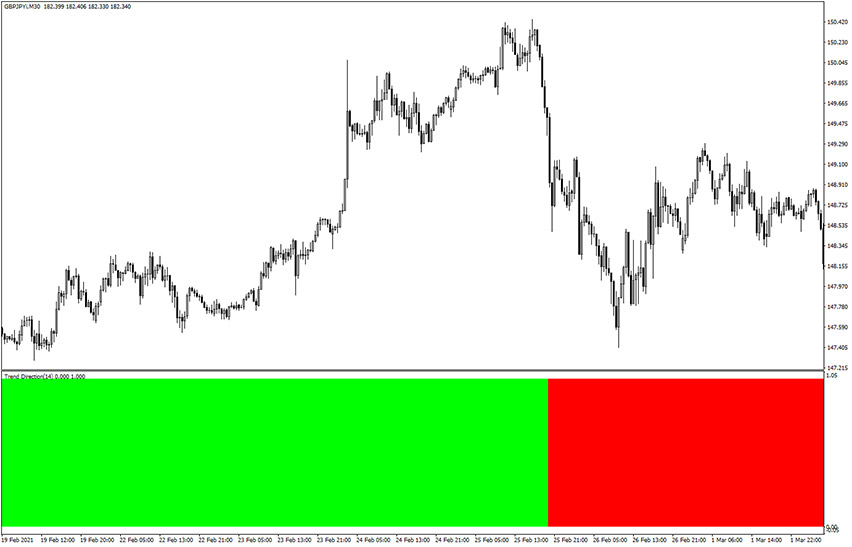
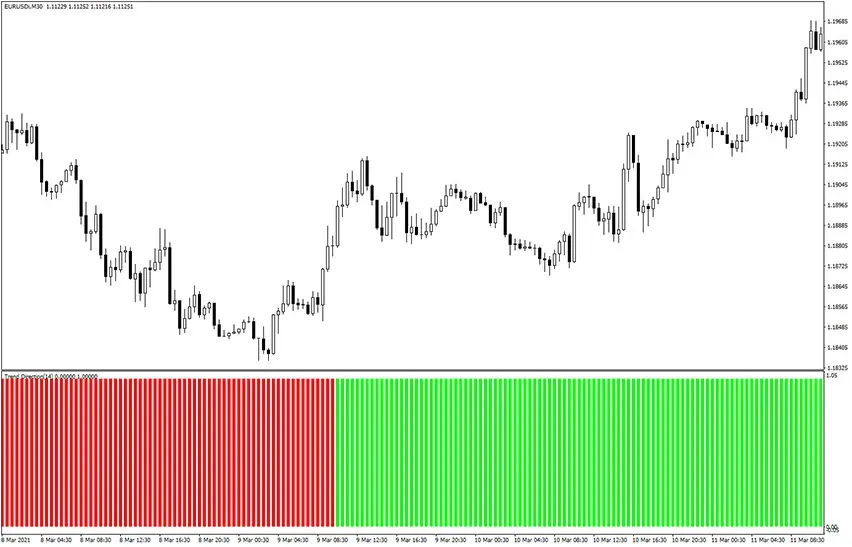
The Trend Direction V2 Indicator uses a two-color histogram to show the market direction.
Green bars indicate bullish conditions, so focus on buy opportunities.
Red bars indicate bearish conditions, so look for sell opportunities.
Trading gets noticeably cleaner once you know the overall trend. The best results come from entering mid-trend rather than reacting to every sentiment shift.
This indicator works best as a filter rather than a standalone signal generator, so it’s worth pairing it with a dedicated entry tool.
Example trade and indicators combination
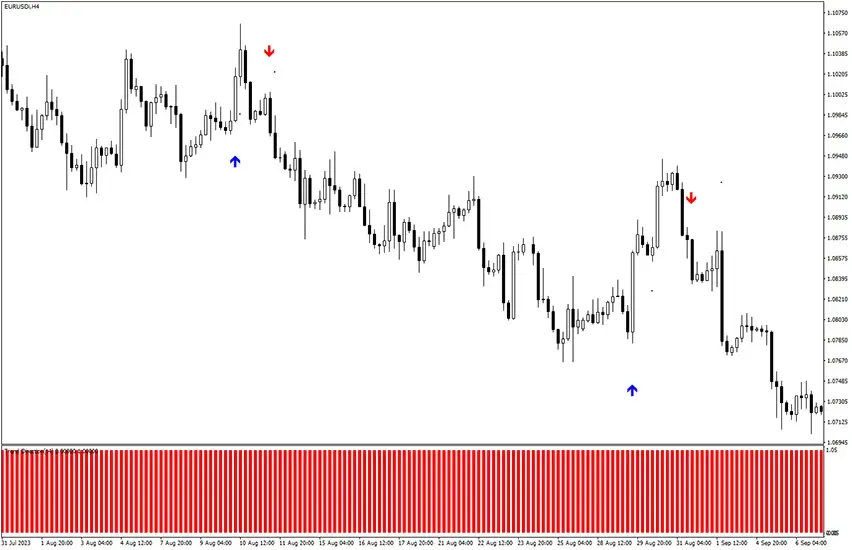
As you can see on the EUR/USD H4 example chart above, this indicator can be paired with the Vulkan Profit Indicator.
It plots simple buy and sell arrows. Together, the two indicators make the risks of trading against the trend much easier to see.
Without the histogram for context, following every arrow would be essentially a coin flip.
Once the two signals align, though, every sell arrow in this example landed a profitable trade.
Bottom line
The Trend Direction V2 Indicator for MT4 won’t generate entries on its own, but that’s not really its job.
Its value comes from filtering out the trades working against the dominant trend.
Pairing it with almost any entry tool tends to noticeably improve the odds of success.