Breakout Zones Indicator
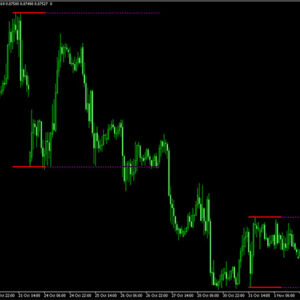
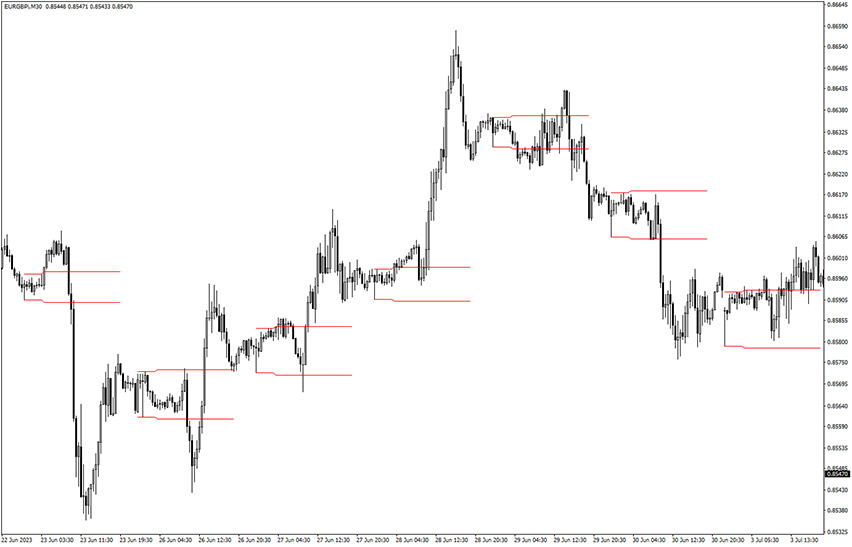
Platform: MT4 Type: Market Levels Last update: December 8, 2024The Breakout Zones Indicator for MT4 draws support and resistance lines on the trading chart. These levels are determined by price fluctuations. The idea here is utilizing the breakout of the key zones instead of their rejections (which is typically the case). When it occurs, there are usually large swings, so potentially you can catch really profitable trades.
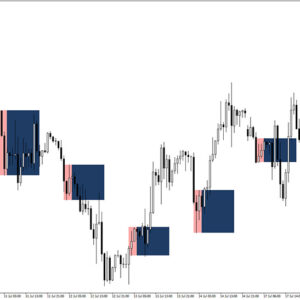
Just take a look at the example visualisations below. As you can see, the argument is confirmed and there were significant moves each time.

Breakout zones in MT4 trading explained
Let’s explain all the necessary concepts that are required for successfull outcomes with this aproach.
So what are these breakout zones?
The zones are being defined by two horizontal lines – one at the top and one at the bottom. In other words, they are specific price thresholds and when exceeded, they show a major change in market sentiment and momentum. You can think in terms of start of a new trend and therefore meaningful change in asset’s price.
The breakout strategy is about entering the market right after the price moves beyond a predetermined area, taking advantage of the momentum’s strength to gain profits from the ongoing price shift.
Who is this tool for?
Actually, it can be effectively used both by beginners and advanced forex traders. The first group of users can apply this to determine market trends and speculate on potential swings before they actually happen. On the other hand, proffessionals could work on developing custom and advanced strategies based on price breakouts from these zones, introducing additional technical analysis MT4 indicators.
When to open long and short trades?
When the price exceeds the upper red resistance line, it often indicates a possible bullish trend. In this scenario, traders might consider opening a long position and setting a stop loss few pips below the last swing low. Similar rules apply when the price drops below the lower red support line, which is the case for the short trade and bearish trend.
How reliable is this breakout strategy?
The success rate of trading the breakout zones indicator depends on the trader’s skill in accurately confirming signals through price action analysis. It’s also important to note that they are typically accompanied by increased trading volumes.
We have also observed that impulse doesn’t always occurs straight away – the price often tend to make small pullback before making powerful moves.
Conclusion
The approach described here has great potential. The key is avoiding fake signals, which unfortunately, happen quite often. In order to minimize risks, one should learn price action patterns or/and onboard verification indicators. Another recommendation is using at least 1:2 risk-to-reward ratio for increased efficiency.
Submit your review | |
thank you very much , i am looking this indicator from long time , i have mt5 version but not this one. thanks buddy