Breakout Zones Indicator
Platform: MT5 Type: Market Levels Last update: December 14, 2024Goal of the Breakout Zones Indicator for MT5 is scanning charts for the special zones with high-probability opportunities. These levels are displayed in the form of two horizontal lines serving as reference points for the potential trades. What’s more, they are both based on specific time interval, thus apply only for a specific slice of the bigger picture. But don’t worry, new ones are generated right after previous pair has expired.
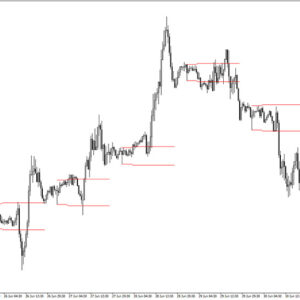
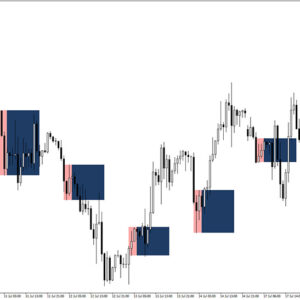
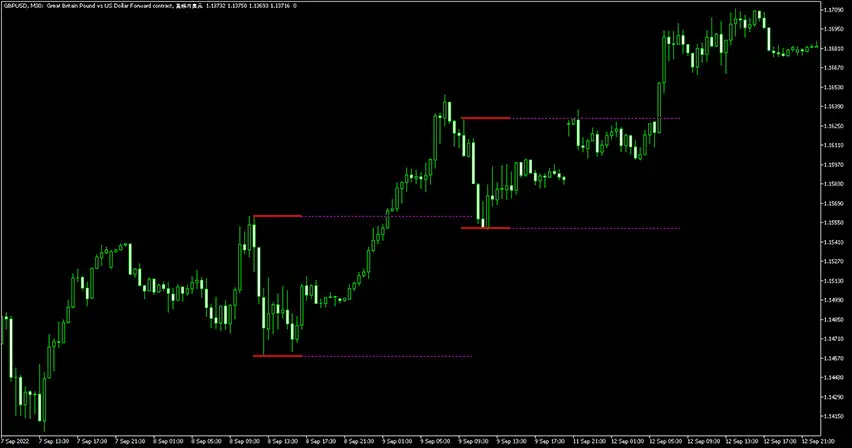
Example chart:
You can think about the lines in terms of support and resistence, however the idea is not to buy at the bottom and sell at the top. Instead, this strategy assumes price breaks and further movement into the new freshly unlocked area. When applied to lower time frames it works just fine for intraday trading approach – and similarly – can be successfully used on higher ones for long term view and less noise.
How to utilize these breakout levels?
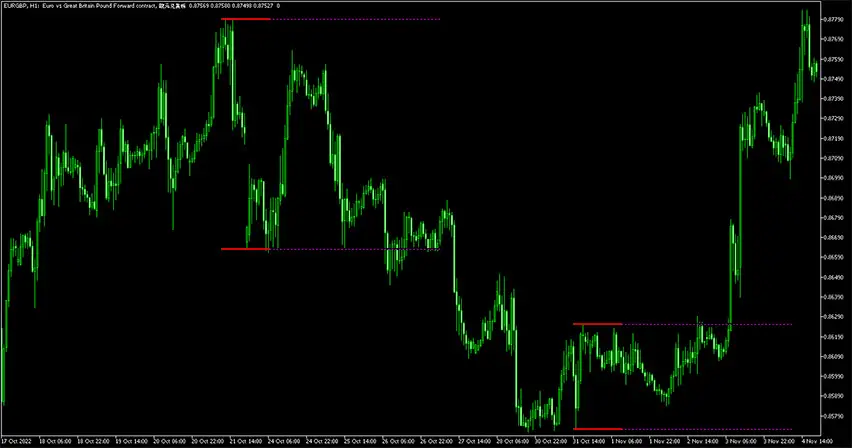
As you can see on the example charts, the horizontal lines of this indicator actually consist of two elements: red thick part and violet dotted part. The first one is a solid foundation, while the other one is expected to be actually broken.
Essentialy, when candlestick breaks through the upper resistance line, a long trade should be executed. Wait for the bar to close for the confirmation. Conversely, a price dropping below to lower support level is a signal for short trade open.
Unfortunately, the tool is not providing take profit target nor stop loss level. Our suggestion is to set stop loss between two bands, just in the middle and for the profit, aim 1:1 risk-to-reward ratio.
Summary
The indicator is based on the concept of period zone, which is customizable in the settings. Whenever the price resides within the zone, the high and low adjust dynamically. For a trigger, a trader should await a breakout and once it occurs place a corresponding trade. The key is to observe with attentin price action during this phase. The fakouts should be realistically counted in and ways to reduce them are price action patterns and onboarding additional technical analysis gauges.
Submit your review | |