

PPMCC Indicator MT5
Platform: MT5 Type: Oscillator Last update: September 13, 2026The PPMCC Indicator for MT5 measures how closely two currency pairs move in relation to each other.
It gives you a numeric read on correlation strength rather than just eyeballing two charts side by side.
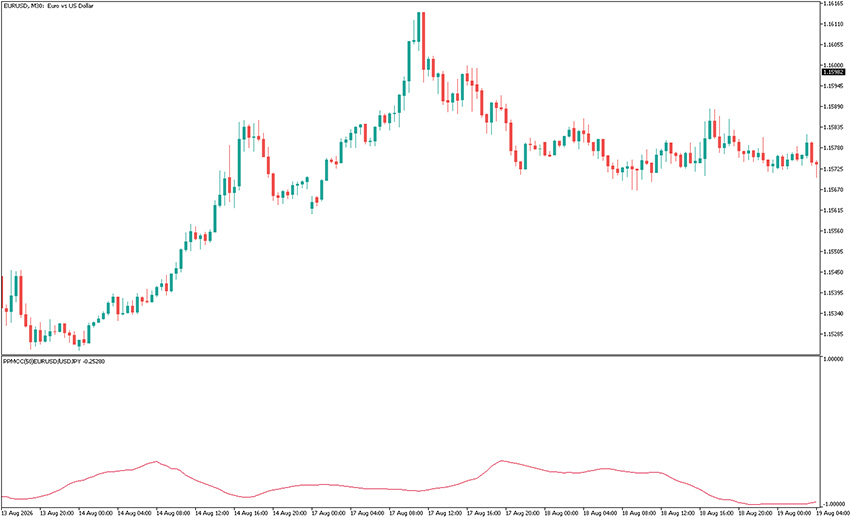
Example chart:
How to use the PPMCC Indicator for MT5?
The PPMCC Indicator plots a single line oscillating between -1 and +1, based on the Pearson Product-Moment Correlation Coefficient calculated from each pair’s moving average.
A reading near +1 means the two pairs are moving in near-perfect sync and a reading near -1 means they’re moving in near-perfect opposition. A reading close to zero means there’s little to no relationship between them at all.
As you can see on the EUR/USD M30 chart above, the correlation with USD/JPY stays negative most of the time.
It drops toward -1 when the inverse relationship is strongest. It moves back toward zero when the relationship weakens.
This is what you would generally expect. EUR/USD and USD/JPY often move in opposite directions because the US dollar is on opposite sides of the two pairs.
Settings
In the settings tab, there are five input parameters:
Period – MA calculation period
First symbol name – the name of the first financial instrument
First symbol applied price – the calculation price of the first financial instrument
Second symbol name – the name of the second financial instrument
Second symbol applied price – the calculation price of the second financial instrument
One detail worth knowing: the first symbol doesn’t have to match the chart the indicator is running on.
If it doesn’t, the reading only refreshes when a new tick arrives on the chart’s own symbol.
The PPMCC Indicator also needs historical price data for both pairs to calculate correctly. If that data isn’t already cached locally, it downloads it first before plotting the line.

