Rate Of Change Indicator
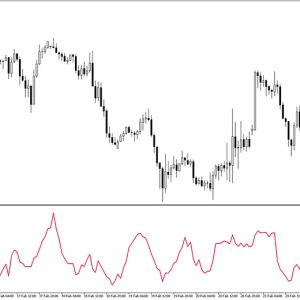
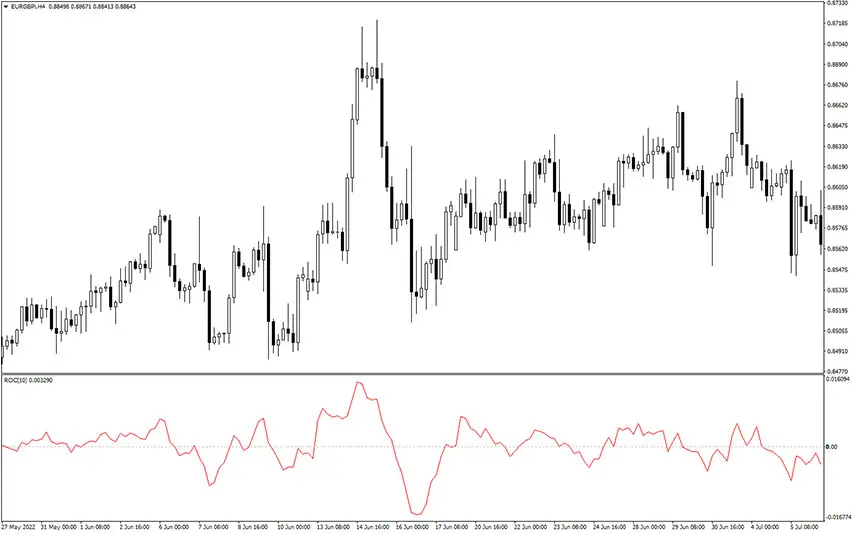
Platform: MT4 Type: Oscillator Last update: November 9, 2024The Rate Of Change Indicator MT4 is a momentum-based technical tool that traders use in the process of technical analysis. Specifically, it measures the percentage change in price between a specific price level in the past and the current price of a currency pair. The rate of change forex indicator is a useful tool for traders looking to identify trends and momentum in the market. The term “ROC” stands for rate of change, and this is exactly what the indicator represents on a chart.
Introducing the Rate Of Change Indicator
When using the ROC indicator in technical analysis, it is measured against the value of zero. If the percentage change is positive and the price has moved higher, the ROC indicator will move upwards. Conversely, if the price has fallen and the percentage change is negative, the ROC indicator will reflect a downwards movement.
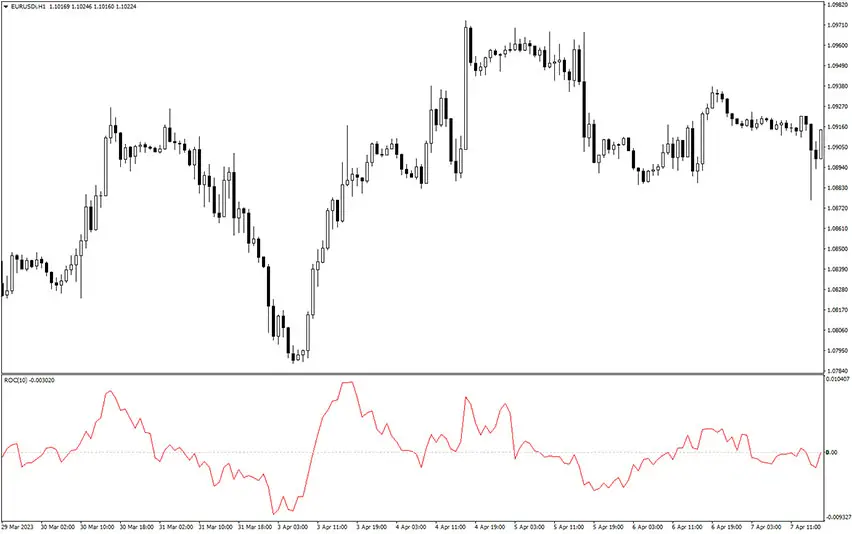
By analyzing the positive and negative outcomes of the rate of change indicator, traders can identify ideal entry and exit points by predicting where the price may go in the future based on past performance. In addition, traders can use the rate of change indicator to identify oversold and overbought levels, centerline crossovers, and divergences, providing valuable insights into market trends and momentum.
How To Use The ROC Indicator In Trading?
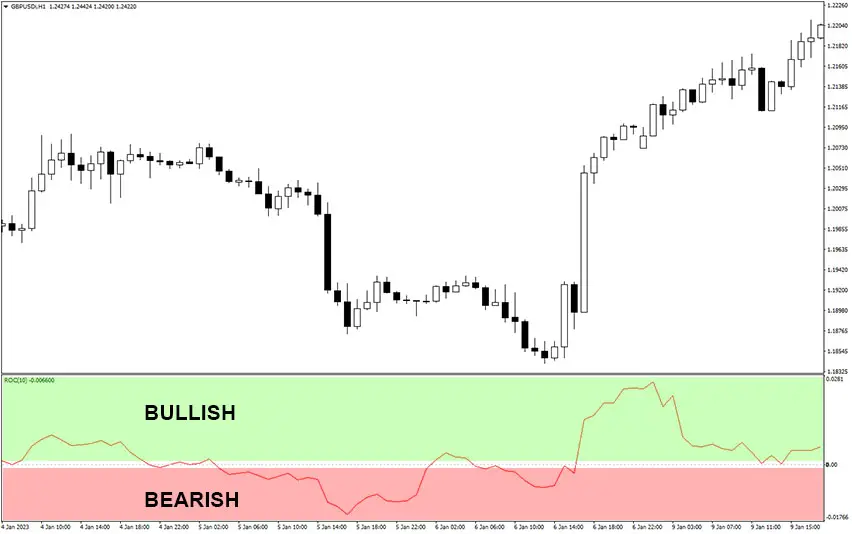
One of the primary methods for finding trading signals using the oscillator is through the zero line crossover. When the oscillator crosses the zero line from bottom to top, it signals a bullish price trend, while a cross from top to bottom signals a bearish trend.
Forex traders can use this information to place a buy trade with a stop loss below the previous swing low. The best take profit strategy is to follow the oscillator and stay long as long as it remains above the zero line. Conversely, if the oscillator falls below the zero line, it indicates a bearish market trend. Traders can enter a sell position with a stop above the previous swing high.
In addition, the strength of the trend can be identified by the speed of the rise or fall from the zero line. A sharp rise from the zero line indicates a strong bullish trend, while a sharp drop from the zero line denotes a stronger bearish market trend.
Conclusion
The MT4 Rate Of Change Indicator is a straightforward momentum indicator that appears as an oscillator line, making it easy to comprehend. It shows upward price momentum when above zero and downward price momentum when below zero. The distance from zero reflects the strength of the price move’s momentum. Traders can use this data to validate trend changes or determine when a trend is gaining or losing momentum. The ROC is commonly employed as a confirming indicator in combination with other indicators.
Submit your review | |