SSD with Histogram Indicator MT5
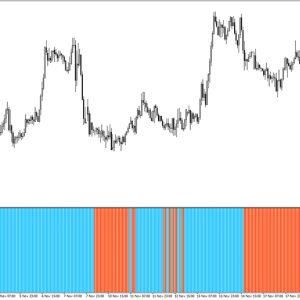
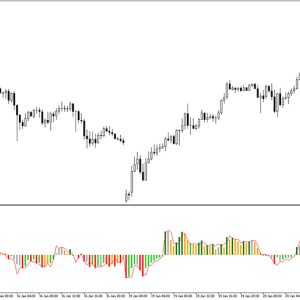
Platform: MT5 Type: Oscillator Last update: June 8, 2025The SSD With Histogram Indicator for MT5 is an oscillator that additionally displays green and red histo bars that respectively corresponds to bullish and bearish momentum. When there are readings contrary to general market bias, it suggests an potential pullback going on.
Example chart:

What do the lines of the ssd histogram indicator for mt5 tell traders?
When it comes to the position of lines, blue one over orange one corresponds to upward movement. Conversely, the opposite setup implies downward trend. Compared to histogram bars, they react more slowly to price fluctuations. Their crossover, combined with alignment in the color of the bars, is often a good trade entry point.
The scale of the indicator is not fixed, so it’s actually better to rely on the colors and crossovers instead finding oversold or overbought levels. Generally speaking, it should be rather used in conjuction with other technical indicators for more holistic approach.
Formula used:
For technical geeks, this is exactly how the calculations are performed:
K = Stochastic D – 50.0
D = SMA(K, %D Period)
Histogram = K – D
Trade analysis
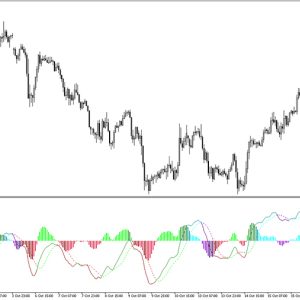
This EUR/USD H1 chart below shows a long setup. You can see how the price found a support a traders should look for buy trade opportunities. An arrows shows the moment where there was a crossover and further confirmation by a green bar. Afterwards, the price rised significantly.

Submit your review | |