3X Parabolic Regression Indicator
Platform: MT5 Type: Channel Last update: September 24, 2024The 3X Parabolic Regression Indicator draws two linear trend channels calculated on the standard deviation (with different periods) and a single curvilinear trend channel calculated on a parabolic regression.
How to apply 3X Parabolic Regression in trading?
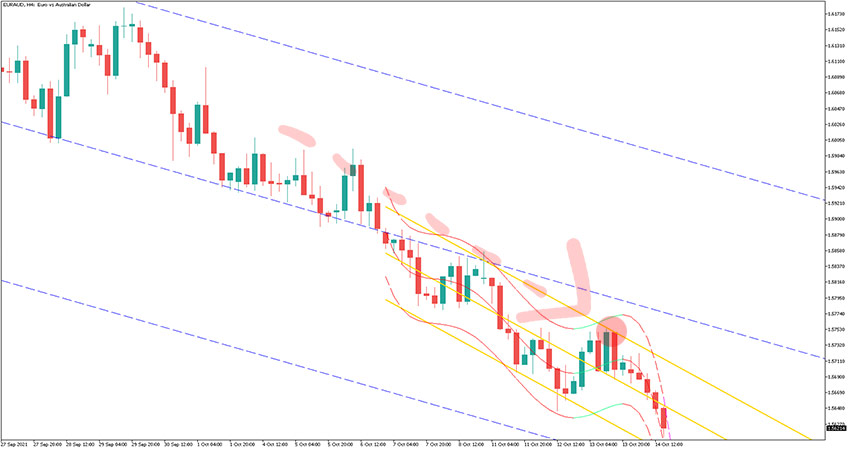
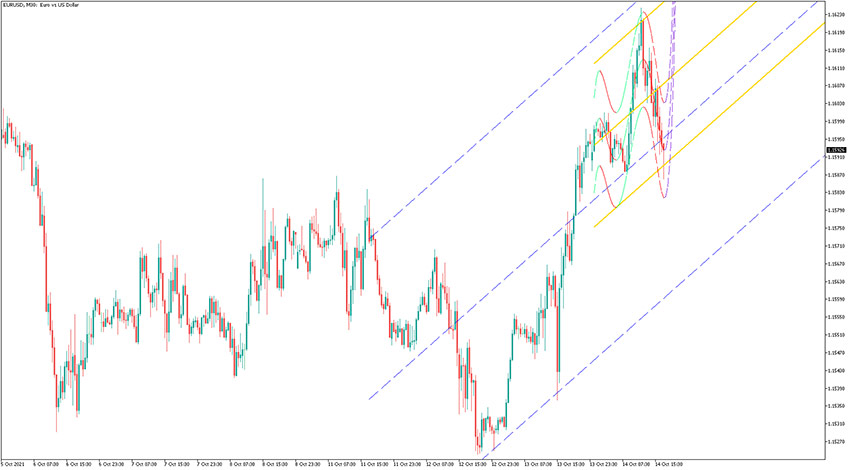
As we mentioned at the beginning of this article, the 3X Parabolic Regression Indicator consists of three channels. Generally speaking, you should be looking for sell trades, at the touch of upper bands of these channels. Conversely, buy trade opportunities occur at the touch of lower bands of the channels.
Buy Signal
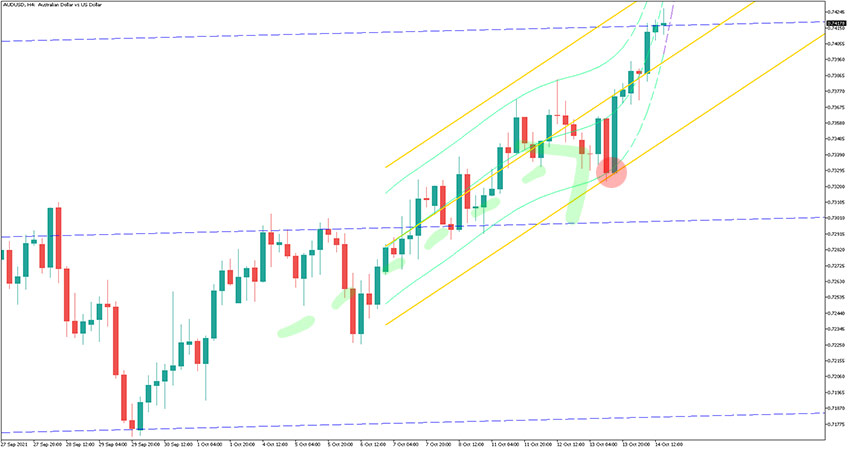
Follow these steps for a long trade:
- The slope of blue and yellow channel is upwards
- Price touches and rejects lower band of yellow channel
- Set stop loss a few pips below the last swing low of the market
- Take profit or exit trade whenever price touches upper band of yellow channel or use your own method of trade exit
Sell Signal
Follow these steps for a short trade:
- The slope of blue and yellow channel is downwards
- Price touches and rejects upper band of yellow channel
- Set stop loss a few pips above the last swing high of the market
- Take profit or exit trade whenever price touches lower band of yellow channel or use your own method of trade exit