Trend Reversal Indicator MT4
Platform: MT4 Type: Reversal Last update: September 19, 2026The Trend Reversal Indicator for MT4 is an oscillator based on two exponential moving averages.
It appears in a separate window below the price chart and helps spot trend reversals, so traders can catch the large price moves that often follow.
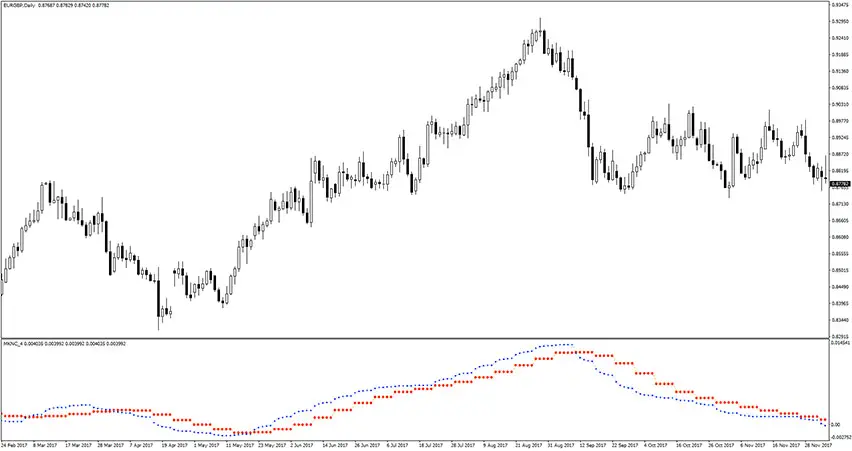
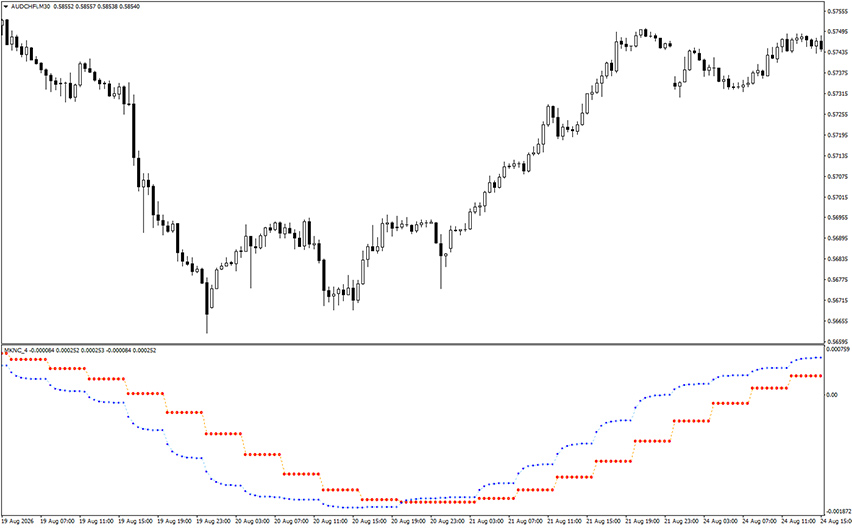
Example chart:
How to use the Trend Reversal Indicator for MT4?
The Trend Reversal Indicator for MT4 plots two lines – a fast ONE (blue EMA ) and a slow one (red EMA). It generates signals whenever they cross.
A buy signal forms when the blue line crosses above the red line, while a sell signal forms when the red line crosses above the blue line.
The recommended entry is the open of the next candle after the crossover.
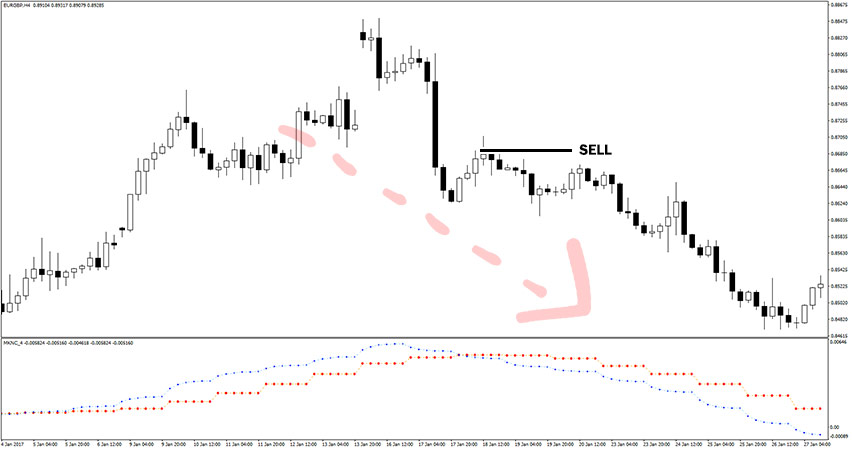
As you can see on the EUR/GBP H4 chart above, the red line crossed above the blue line, triggering a sell signal right as price began a sustained decline.
This is the pattern the indicator is built to catch: a clean crossover lining up with the actual start of a new trend.
Bottom line
The Trend Reversal Indicator for MT4 strips reversal trading down to a single, easy-to-read crossover.
This is simple enough for beginners, but still useful for experienced traders looking for a quick trend-shift signal.
Stick to higher timeframes, respect the occasional false signal during choppy conditions and it becomes a solid foundation for a broader reversal strategy.