New VWAP Indicator MT4
Platform: MT4 Type: Trend Last update: August 15, 2026The New VWAP Indicator for MT4 (Volume-Weighted Average Price) plots the average price of a currency pair based on trading volume.
It displays three lines: green, red and yellow, giving you a layered view of how volume is shaping price.
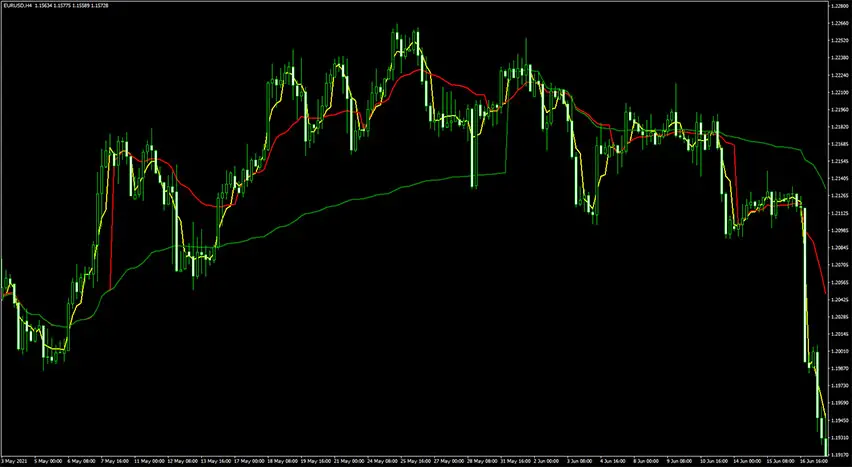
Example chart:
How to use the New VWAP Indicator for MT4?
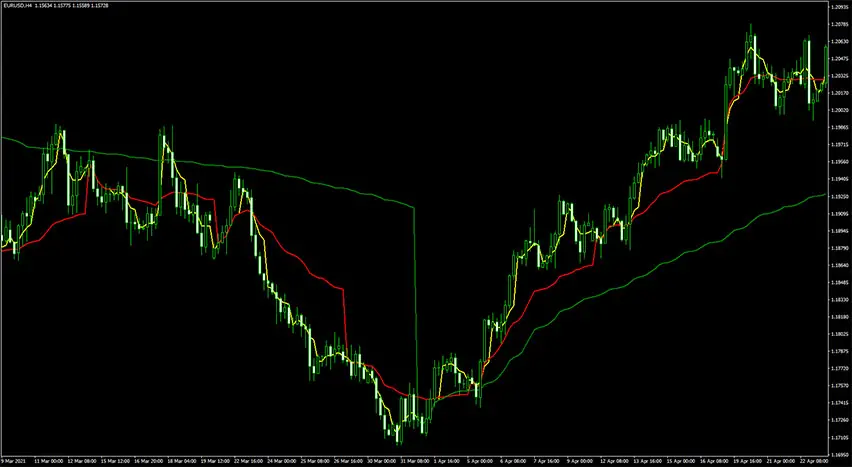
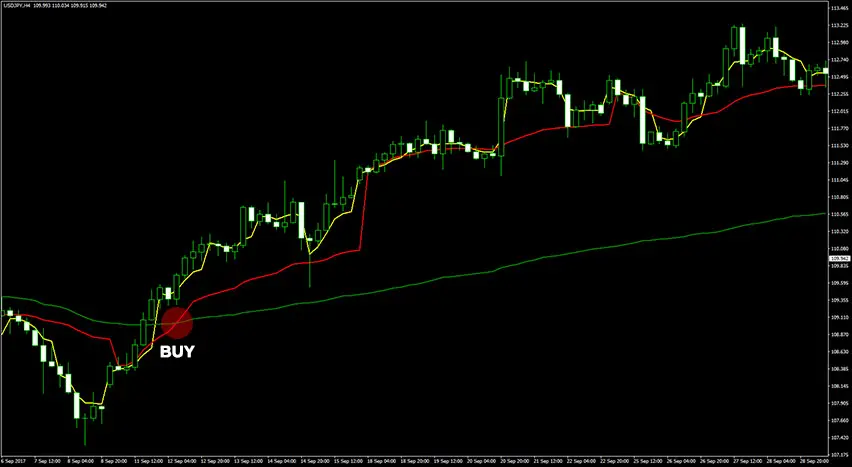
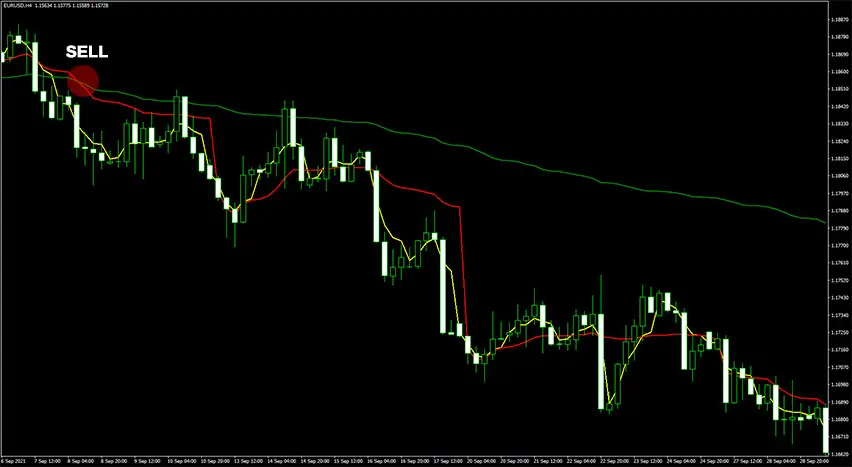
This New VWAP Indicator plots three lines, namely daily (yellow), weekly (red), and monthly (green). Each built from volume-weighted average price rather than closing price alone.
Signals form when the weekly and monthly lines cross.
A bullish signal appears when the red line moves above the green line and a bearish signal appears when it moves below. The daily line stays neutral and simply tracks the trend, rising during uptrends and falling during downtrends.
The indicator works on any timeframe, but performs best on the hourly chart, where it tends to produce fewer false signals.
This USD/JPY H4 chart shows an example long trade.
This EUR/USD H4 chart shows an example short trade.
Summary
What sets the New VWAP Indicator for MetaTrader 4 apart is the three-line structure itself. Daily, weekly and monthly VWAP rarely agree, and that’s the point.
When all three line up in the same direction, you’re looking at a level with real weight behind it, not just short-term noise.
Use the crossovers as your trigger, but let the alignment of all three lines tell you how much conviction to put behind the trade.